

Charting Bitcoin epochs before the masses joined in. #npub1umh9k3yuygx7l6nrwwu20c28e27k0s4ak5qk3p4lvzt2836rtfsse626me
Seattle, WA
Joined May 2018
- Tweets17.1K
- Following8.6K
- Followers82.7K
- Likes27.5K





S&P 500 vs Gold — Sep 2026
S&P 500: 7,669 | Gold: $4,319/oz
Ratio: 1.78
#SP500 #Gold #Markets #BitcoinChartBot

1
3
1,101

#Bitcoin 1-Year Price Multiple as of 2026-11-18
Current Price: $63,260
Price 1 Year Ago: $92,911
1-Year Price Multiple: 0.68 $BTC #BitcoinChartBot

3
1,629



Bitcoin Price: $64,633.51
200-Day MA: $72,728.27
Mayer Multiple: 0.89 🟢
As of 2026-11-17
#MayerMultiple $BTC #BitcoinChartBot

10
2,097
ChartsBTC retweeted

Highest net loss realization by Bitcoin holders since July 13, the equivalent to 25.8K BTC.


#bitcoin power law
Current price is $64,272
Current Power Law price is $146,080
Current price is 56.00% below trend
Current price is 886 days behind trend
PowerLaw date for current price: 2024-06-14
#PowerLaw $BTC #BitcoinChartBot

1
8
2,024
#Bitcoin 4-Year ROI as of 2026-11-17
Current Price: $63,690
Price 4 Years Ago: $16,686
4-Year ROI: 282% $BTC #ROI #BitcoinChartBot

9
1,899

ChartsBTC retweeted

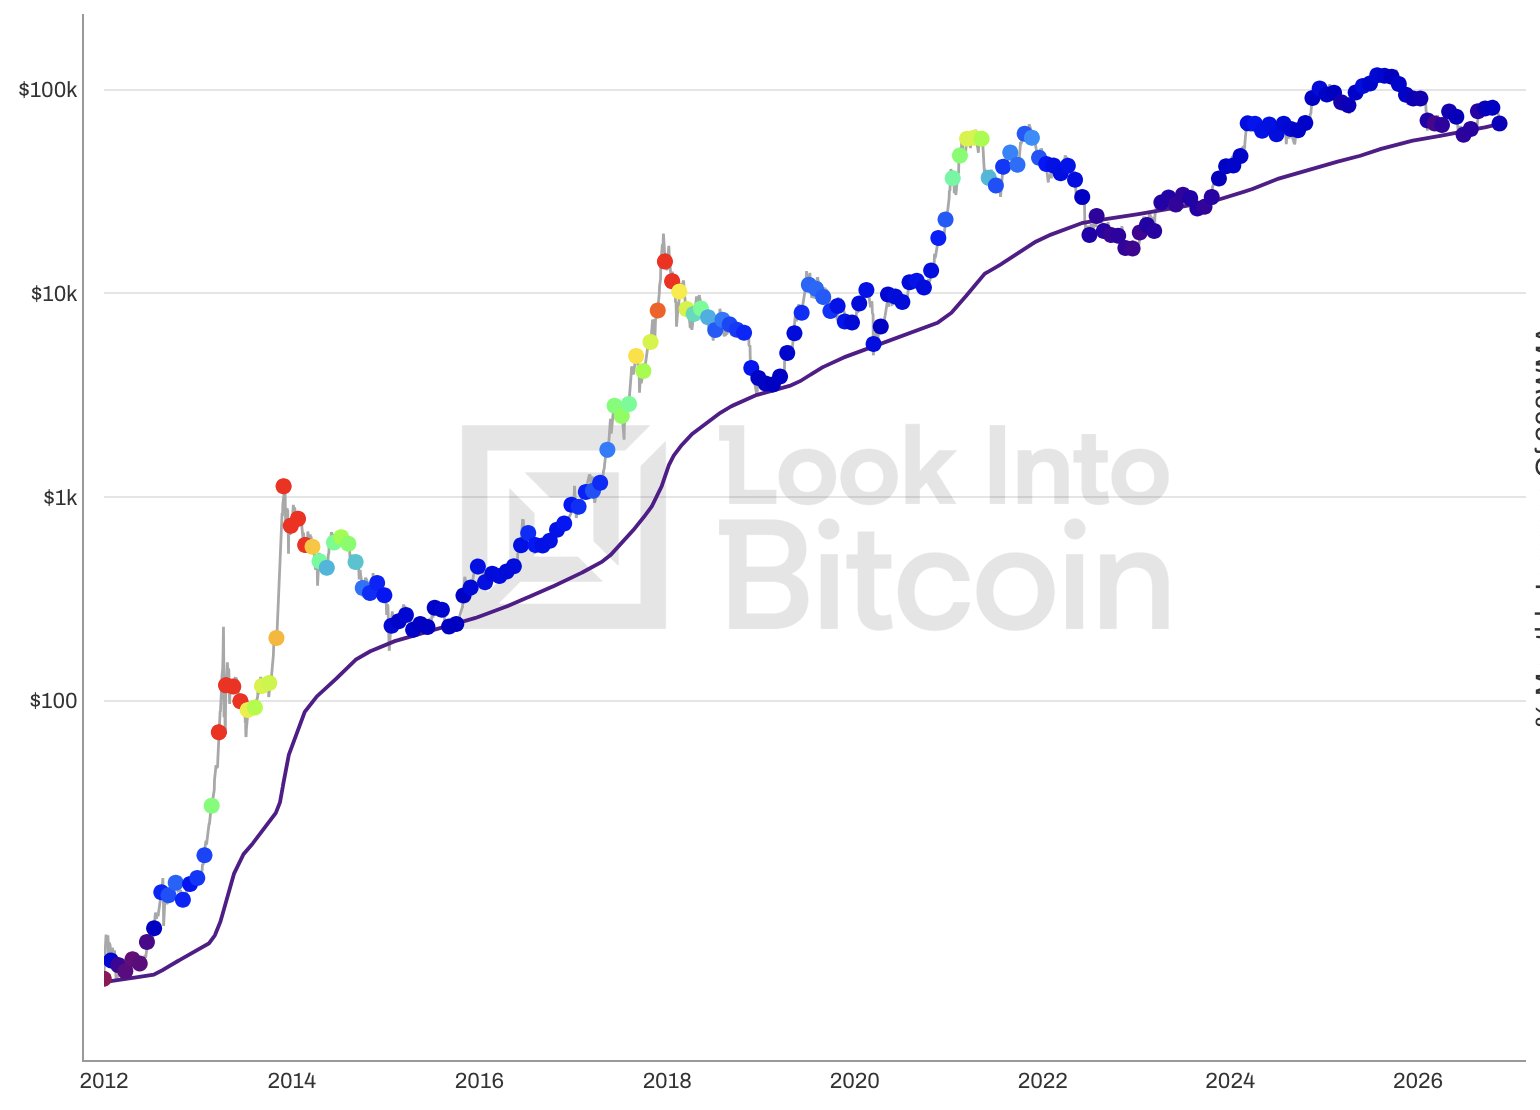
To handle Bitcoin's volatility, simply strip out the volatility and look at the long term trend.
This is the 200-week moving average of Bitcoin's realized price, the cost basis for the entire network.
What do you notice? Interestingly, it only goes up.
YoY growth using Nov. 16 as a snapshot each year:
2020: +50.6%
2021: +93.8%
2022: +55.7%
2023: +29.9%
2024: +33.0%
2025: +31.6%
2026: +27.8%
The trend is your friend:

ChartsBTC retweeted

Bitcoin's 200-week average (its average price over the prior 4 years)…
has only gone UP 653 weeks in a row.
Not a single down week since 2014.
(can’t start before 2014 since you need four years of prior data)
By contrast… gold’s fell for 196 weeks.
Long Treasuries: 226 weeks down.
Bonds: 154 weeks down.
By the way, you can pick ANY day of the week and make that the weekly close and this still holds up.
h/t @dotkrueger

ChartsBTC retweeted

The feeling that bitcoin is over is real. Not that it will fail, but that waiting 20 years for the next 10x is not worth staying engaged over.

Bitcoin 4-Year CAGR as of 2026-11-17
Current Price: $64,861
Price 4 Years Ago: $16,686
4-Year CAGR: 40%
#CAGR #BitcoinChartBot $BTC

5
2,035
Bitcoin Current Price: $65,250.23
Price change over the last 24 hours:
High: $65,609.60 Low: $63,815.27
#Bitcoin $BTC #Bitcoin24hr

6
2,116

Bitcoin latest price on 2026-11-16: $64,855.
Mayer Multiple: 0.89.
#MayerMultiple $BTC #BitcoinChartBot

1
3
1,939
Bitcoin price on 2026-11-16: $65,080.
100w MA: $88,889, Price / 100w MA: 0.73
#Bitcoin $BTC #BitcoinChartBot #WeeklyAverage

9
1,891