

40+ years helping financial professionals stay ahead of market trends. We do not reply to DMs/comments. For support, visit https://teapawt.org/t.co/nXEDyR00YV.
- Tweets26.3K
- Following291
- Followers122K
- Likes3.2K





ALT The image is a section of a webpage titled “Anthropic IPO: A Risk Perspective” from FactSet Insight. The text discusses the expected price range for Anthropic's IPO and its significance as a potential second mega-cap IPO of 2026, referencing SpaceX.

ALT Text on the image reads, "2026 Election Results Could Signal Changes in Utility Regulation." The background is light blue with curved blue and black shapes. The logo for Article Audio appears in the bottom right corner.

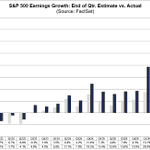
ALT Bar chart showing S&P 500 earnings growth by quarter, comparing end-of-quarter estimates to actual figures, sourced from FactSet. Bars represent Q1 2014 to Q4 2023, with actual earnings generally higher than estimates in recent quarters.

ALT Bar chart titled "S&P 500 Sector-Level Earnings Surprise %: Q3 2026 (Source: FactSet)." It shows earnings surprises for various sectors. Health Care leads with 13.7%, followed by Utilities at 10.5%, Energy at 8.0%, and Industrials at 7.2%. Information Technology shows 6.2%, Consumer Staples 4.5%, Financials 3.9%, S&P 500 overall 3.1%, Real Estate 2.5%, Materials 1.1%, and Consumer Discretionary 0.4%. Communication Services has the lowest at -22.1%.

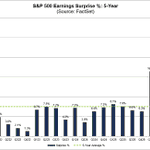
ALT Bar chart showing S&P 500 earnings surprise percentages over a 5-year period, sourced from FactSet. The data points range from -7.1% to 25.8%, with a 5-year average percentage marked by a green dotted line. Notable high surprise of 25.8% in Q2 2020 and a low of -7.1% in Q2 2023.

ALT The image is a FactSet Insight article about the Canadian energy sector. It includes text with the title "Duration Drives the Rush for Canadian Upstream Assets," and discusses the strategic pivot involving the Trans Mountain pipeline and LNG Canada Phase 1. The article mentions deals in 2026 and is authored by Andrew Jeffries. The layout includes a green "Energy" label, grid background, and a "Read More" link.


ALT The image contains a graphic with the FactSet logo in the top left corner. A quote is displayed: "Enterprise AI is not one product. It is a stack of interoperating capabilities that must be selected, connected, and governed to drive real business outcomes." To the right of the text, there are colorful abstract shapes resembling charts and figures.

ALT Blue graphic with wavy patterns and bold text stating, "Market Is Punishing Negative EPS Surprises Less Than Average for S&P 500 Companies for Q3." Article Audio logo in the corner.

ALT A screenshot of the FactSet Investment Dashboard Demo. The interface displays various financial data in tables and charts. The portfolio summary is shown at the top, featuring investment totals and performance metrics. Below are two bar charts titled "PnL Chart YTD" and "Volume," illustrating respective financial trends over time. The dashboard uses a dark theme with blue accents for data visualization.


ALT FactSet Insight webpage titled "When Portfolio Construction Becomes Easier to Use, Compute Must Scale with It." Includes a subheading about optimizing portfolio construction and a byline.


ALT ```plaintext A webpage titled "Anthropic Valuation Hypothetical Market Impact: A Stress Test Perspective," discusses the potential market effects of Anthropic's IPO and its product, Claude. The page is from FactSet and includes a "Read More" link. ```


