

OAK Research is a crypto market intelligence platform that provides research, analysis and data — French account : @OAK_Res_FR
Joined October 2024
- Tweets2.1K
- Following196
- Followers4.6K
- Likes2.4K







Pinned Tweet
🫡 We are proud to announce that OAK Research has been elected to serve on the @ethena Risk Committee.
We would like to thank everyone who supported our application and placed their trust in us. This election represents an important milestone for OAK Research and a new responsibility toward $ENA holders.
Our work will from now on be divided into two distinct areas: our ongoing research and coverage of Ethena, and our Risk Committee work on risk parameters and protocol improvements.
These activities will remain separate and be conducted independently of one another. Through both, we aim to improve transparency, broaden coverage of the protocol’s evolution, and clearly explain the rationale behind our decisions.
We look forward to working closely with the Ethena team and the other newly elected committee members @Kairos_Res and @BlockworksAdv.
Our goal is, and always has been, to support Ethena in the best way possible. We will continue doing so throughout our mandate.
Thank you once again to the Ethena community for its trust.
Let’s ride.

🟣 OAK Research turns two today.
We launched on October 29, 2024, with the goal of building the first French crypto research firm and going deeper than the daily noise.
Two years later, our focus has moved from technical deep dives to investment theses. We see ourselves first as a team of investors, and everything we publish is meant to help you make better decisions.
Here’s where we stand today:
▫️ 800,000+ page views on the website since launch
▫️ Nearly 8 million views across our socials over the past year
▫️ Nearly 70,000 people following our work
That growth also opened doors. This year, we started working with protocols we wouldn’t have imagined signing at launch, including @ethena, @aave, @maplefinance, @Plasma, @re, @PythNetwork or @krakenfx.
The team grew along the way, from three people at launch to nearly ten today. Huge thanks to @Artem_Oak, @LilianAliaga_, @DecryptTV, @oak_intern, @_prenomnom_, @MaximilienP51, @0xApart and @Prometherr for building OAK every day.
And thank you to everyone who reads, shares and trusts our work.
Year three starts now. Job’s not finished.
Try OAK Premium free for 7 days and get 30% off with the code "1ANOAK": oakresearch.io/en/upgrade

🚨 Tonight, the Fed is expected to leave rates unchanged after September’s hike.
In reality, with current probabilities at 95% for no change, tonight’s FOMC is a near non-event, since the outcome is already almost known.
As with the last few meetings, it all comes down to Warsh’s speech.
With inflation at 3.7% in September and the US 10-year above 5% in October, markets still price roughly a 75% chance of a December hike.
Two things should tell us whether it will be confirmed.
The first is Warsh’s message, especially if he hints that September’s hike could be the last of the year. The second is any dissenting votes in favor of another hike.
You can now follow this kind of event on our new calendar, free and open to everyone. It brings together:
▫️ Token unlocks
▫️ The most important macro events
▫️ Company earnings
With, for each event, the Fed probabilities, earnings estimates and expected figures for macro data.
This week, for example, you’ll find the FOMC, PCE and GDP on Thursday, $GOOGL, $MSFT and $AMZN earnings, and the $EIGEN and $SUI unlocks.
Find it on OAK Research (link in the comments) 👇


OAK Research retweeted
🟣 Ethena Pay launches Earn+ and offers up to 12% APY on USDe.
Launched a month ago in around fifty countries, @EthenaPay already has about 1,400 active users, who have deposited more than $8 million in ethereum:0x4c9edd5852cd905f086c759e8383e09bff1e68b3 into the app and have already surpassed $750 000 in weekly spending with the card.
Until now, these deposits automatically earned up to 6% per year.
With Earn+, open to all app users, this yield can rise to as much as 12%. There is no lock-up, and Ethena Pay charges no fees on deposits or withdrawals.
But how can Ethena Pay offer such a yield on USDe?
It all relies on a well-known looping strategy in DeFi, which Earn+ makes accessible to as many people as possible.
The funds are deposited into an external vault managed by Upshift and Steakhouse. This vault repeats the same operation on an Aave v4 market deployed on @avax :
◻️ It deposits USDe as collateral.
◻️ It borrows ethereum:0xdac17f958d2ee523a2206206994597c13d831ec7 against this collateral.
◻️ It uses this USDT to buy back USDe, which it in turn redeposits.
◻️ It repeats the process until reaching leverage of about 11x.
Regarding the security of the operation, on @aave v4, as on v3, the USDe oracle is pegged to USDT. A temporary depeg of USDe on the market therefore does not trigger a liquidation on its own.
For now, the vault is capped at $4.5 million in total. Each user can deposit up to $20,000 in Standard, $50,000 in Pro and $200,000 in VIP. The global cap will be raised as it fills up.

Introducing Earn+: up to 12% rewards on your dollars in a single click.
Available exclusively on @EthenaPay.
🟣 Ethena Pay launches Earn+ and offers up to 12% APY on USDe.
Launched a month ago in around fifty countries, @EthenaPay already has about 1,400 active users, who have deposited more than $8 million in ethereum:0x4c9edd5852cd905f086c759e8383e09bff1e68b3 into the app and have already surpassed $750 000 in weekly spending with the card.
Until now, these deposits automatically earned up to 6% per year.
With Earn+, open to all app users, this yield can rise to as much as 12%. There is no lock-up, and Ethena Pay charges no fees on deposits or withdrawals.
But how can Ethena Pay offer such a yield on USDe?
It all relies on a well-known looping strategy in DeFi, which Earn+ makes accessible to as many people as possible.
The funds are deposited into an external vault managed by Upshift and Steakhouse. This vault repeats the same operation on an Aave v4 market deployed on @avax :
◻️ It deposits USDe as collateral.
◻️ It borrows ethereum:0xdac17f958d2ee523a2206206994597c13d831ec7 against this collateral.
◻️ It uses this USDT to buy back USDe, which it in turn redeposits.
◻️ It repeats the process until reaching leverage of about 11x.
Regarding the security of the operation, on @aave v4, as on v3, the USDe oracle is pegged to USDT. A temporary depeg of USDe on the market therefore does not trigger a liquidation on its own.
For now, the vault is capped at $4.5 million in total. Each user can deposit up to $20,000 in Standard, $50,000 in Pro and $200,000 in VIP. The global cap will be raised as it fills up.
Introducing Earn+: up to 12% rewards on your dollars in a single click.
Available exclusively on @EthenaPay.
OAK Research retweeted
🚨 $HOOD drops more than 10% after releasing its earnings
On paper, the quarter had plenty to reassure the markets.
@RobinhoodApp reported record revenue of $1.42 billion in Q3 (+12% year over year), driven by record volumes:
• $992 billion in notional equity volume (+53%),
• 905 million options contracts (+48%),
• 16.4 billion event contracts on prediction markets (up more than 7x).
However, several signals worried investors, and the stock, which had already lost nearly 20% over the past month, fell sharply again. Here is what weighed on it:
◻️ Earnings below expectations.
Diluted EPS came in at $0.51, versus roughly $0.56 expected, with net income down 14% to $476 million.
Part of the gap comes from an unrealized loss of $67 million on Robinhood Ventures Fund I, the rest from a tax expense that nearly doubled ($149 million versus $78 million a year earlier).
◻️ Record volumes, but a declining take rate.
The number of options contracts traded rose by 48%, while options revenue grew by only 31%. Robinhood now earns about $0.44 per contract, compared with nearly $0.50 a year ago.
This is explained by its compensation model. Market makers pay Robinhood for each contract, and that amount decreases when spreads tighten or when clients place multi-leg orders.
And management acknowledged that spreads were even slightly tighter at the start of Q4.
◻️ Decline in crypto revenue
Crypto revenue fell 55% to $120 million, a much steeper decline than that of volumes (-38%).
The take rate thus dropped from about 33 to 24 basis points, partly because Bitstamp, whose fees are much lower, now accounts for 58% of the group’s crypto volumes.
◻️ Slowing net deposits.
Robinhood brought in $15.7 billion in Q3, compared with $21.7 billion the previous quarter, a decline of about 28%.
This slowdown weighs heavily, especially since, according to management, the majority of new deposits come from people who are already Robinhood customers.
This shows that the platform is finding it increasingly difficult to attract new customers and therefore to expand its user base.
◻️ Rising costs
Opex (operating expenses) climbed 16% to $739 million, notably because provisions for credit losses rose from $26 million to $71 million with the growth of the Gold Card. As a result, net margin fell from 44% to 33%.
To sum up, Robinhood did record record volumes this quarter, but its revenue did not keep pace.
Added to this are the decline in crypto revenue, the slowdown in deposits and rising costs, which did not reassure investors at all.
In our view, the recovery could partly come from Robinhood Chain.
In its first quarter on mainnet, the chain entered the top 5 blockchains by revenue and volume. It recorded more than $80 billion in DEX volume, more than the app and Bitstamp combined, and more than $50 million in chain fees.
If crypto activity picks up again, it could become a real growth driver for Robinhood.
OAK Research retweeted
🟣 Do the DEXs with the most listed pairs necessarily generate the most volume?
Since the new perps DEX meta, the listing race has accelerated significantly.
Each platform keeps listing new markets (stocks, commodities, pre-market) in order to attract new traders, to the point that the number of available pairs has now become a growth argument in its own right.
However, our infographic shows that this figure is not necessarily a relevant indicator of a protocol’s actual activity:
◻️ @Aster_DEX and Variational are the two platforms offering the most markets, with 592 and 574 perps markets respectively, compared with 346 for Hyperliquid.
Yet @HyperliquidX processed $7.22 billion in volume over the last 24 hours, almost twice as much as Aster and Variational combined ($3.9 billion).
◻️ On Aster and @variational_io, around three quarters of markets record less than $100,000 in daily volume, and more than 40% don’t even exceed $10,000.
◻️ On Hyperliquid, the situation is completely different. 141 markets exceed $1 million in daily volume, including 59 above $10 million, which is more than Variational, Lighter and Aster combined.
◻️ The same pattern can be seen on @Lighter_xyz, which is the DEX with the fewest listed markets (199 currently). Yet the DEX generates more volume than Aster, with $1.87 billion recorded versus $1.53 billion for its competitor.
The number of listed markets is therefore currently more of a marketing argument than a genuine indicator of activity. That said, having many illiquid pairs is not necessarily a disadvantage for a perp DEX.
Indeed, as long as the infrastructure and maintenance costs of these markets (oracles, risk parameters, market making) remain low, each of them can remain profitable despite limited volume.
They also broaden the platform’s offering, which can attract new traders, and some of them may eventually become liquid.
OAK Research retweeted
🟣Plasma One hits a new record
223 days. That’s how long it took Plasma One to surpass ~$100 million in spending through its card.
Launched on March 17, @Plasma card crossed this milestone on October 26, in just over 7 months. No other crypto card with payments verifiable onchain had reached this threshold so quickly.
For a sense of scale, @ether_fi, which held the record until now, took 371 days to reach this threshold. Kolo and Karta needed around 600 days, and Gnosis Pay 643 days, almost three times as long as Plasma One.
An important note: this ranking only includes cards whose volumes can be tracked onchain and are therefore 100% reliable.
KAST, Tria and RedotPay are therefore not included, nor is Wirex One, which inherited Wirex’s existing customer base.

🟣Is the Lighter x Robinhood farming still worth it?
In August, we told you about the points program launched by @Lighter_xyz to accompany its integration into Robinhood Wallet. At the time, daily volume on Lighter @RobinhoodApp Chain was around $5 million. It now exceeds $480 million.
The window of the early days has therefore closed, and points are much more diluted than at launch.
That said, we believe this farm remains one of the most interesting at the moment.
First, because the reward has gained value. Driven by the announcement of a license application with the CFTC, ethereum:0x232ce3bd40fcd6f80f3d55a522d03f25df784ee2 surged this week, and the airdrop allocation is now worth nearly 45% more than in August.
Second, because volume is no longer everything. Lighter has introduced several boosts that stack, and for the same activity, a farmer who uses them well can walk away with a share of the points drop far larger than another’s.
One question remains on everyone’s mind: how much will a point be worth at the end of the campaign?
We explain how to make smart use of the different boosts, as well as our estimates of what a point could be worth, in our full analysis on the Alpha Feed 👇


🟣 Hyperliquid’s Assistance Fund is set to receive $15.9M for the second AQAv2 cycle, 9% more than for the first.
As a reminder, since AQAv2 went live, the ethereum:0xa0b86991c6218b36c1d19d4a2e9eb0ce3606eb48 deployers on @HyperliquidX (@coinbase for the treasury, @circle for the technical side) pass on roughly 90% of the yield on their reserves to Hyperliquid, net of costs.
Every 30 days, the revenue accumulated by AQAv2 is transferred to the AF, which, it’s worth recalling, uses the vast majority of its revenue to buy back $HYPE directly on the market and burn it.
At the current pace, this would translate into roughly $193.6M of additional annual buy pressure, regardless of how trading activity on Hyperliquid evolves.

OAK Research retweeted
🟣 Why are options getting cheaper on Derive while volume is exploding?
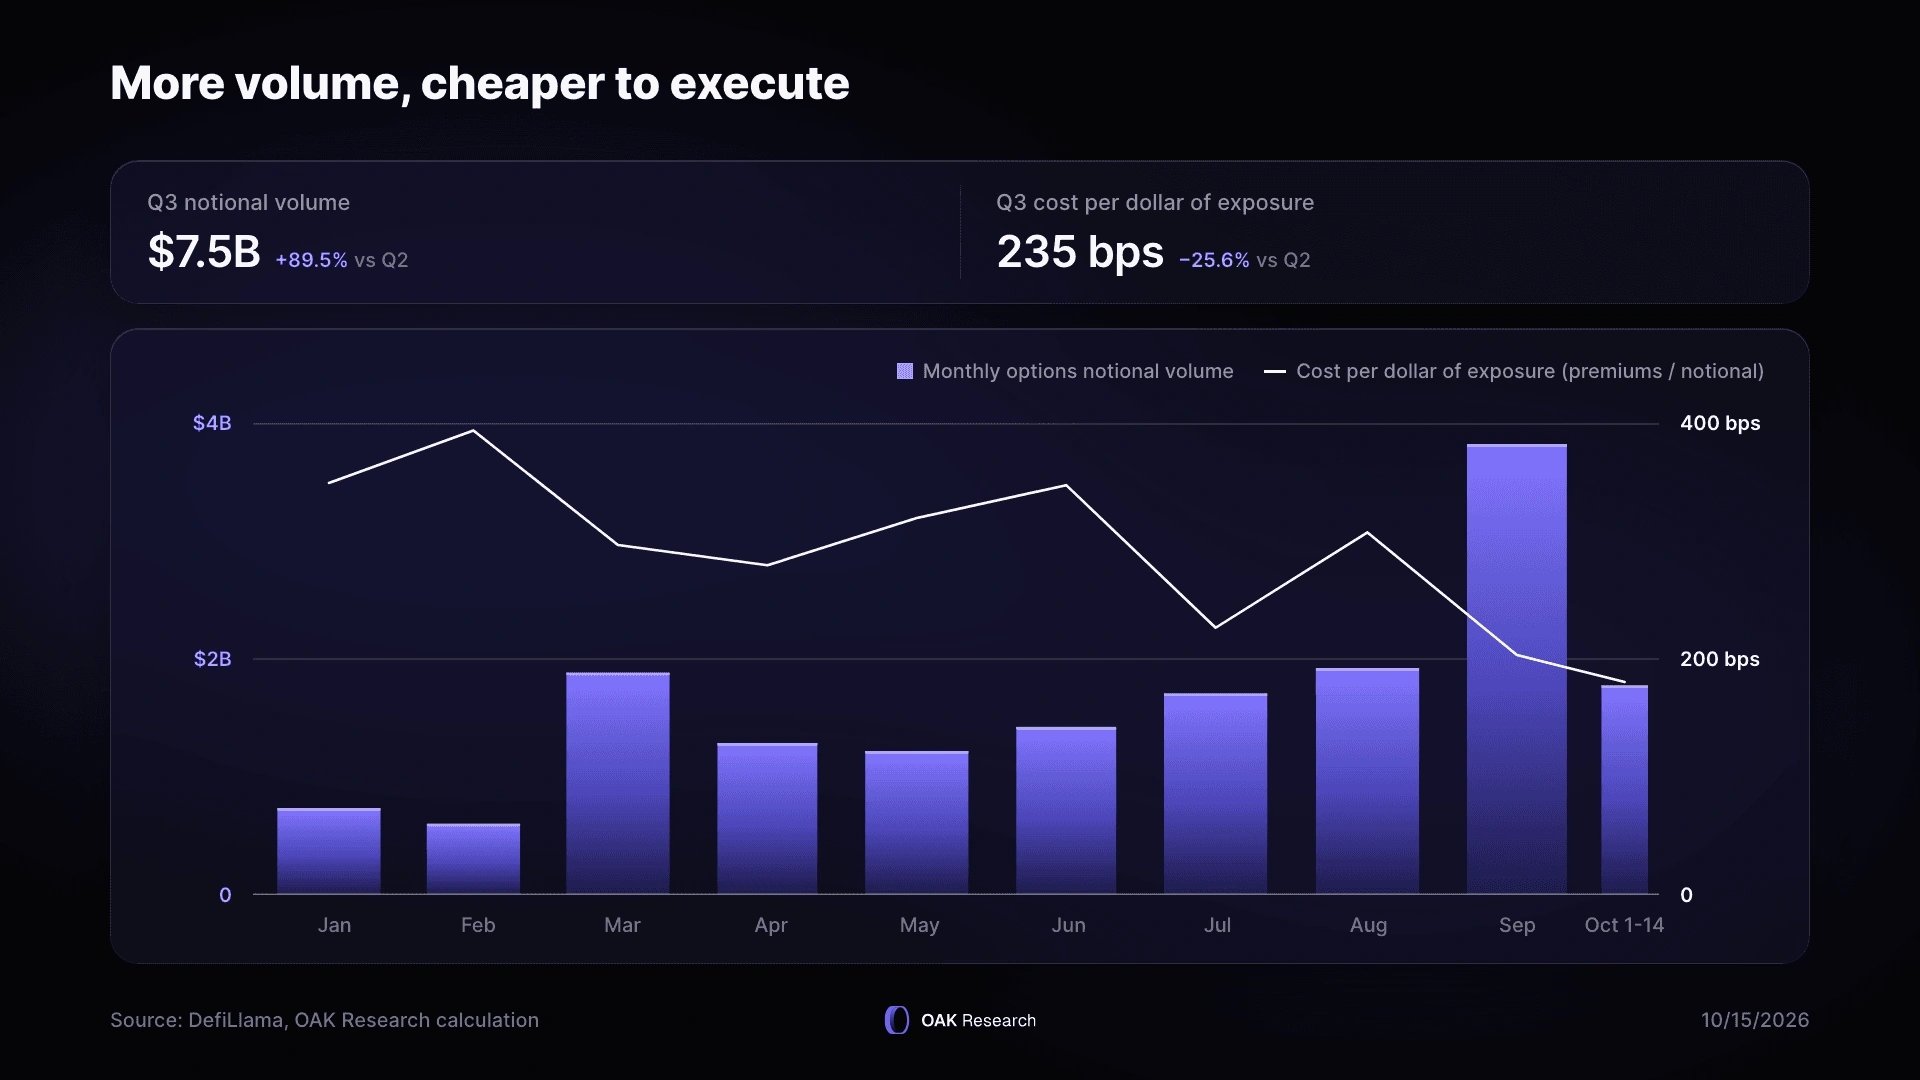
In Q3, Derive processed $7.5 billion in notional volume, up 89.5% from the previous quarter. Over the same period, the cost per dollar of exposure fell by 25.6%, to 235 basis points.
As a reminder, this cost corresponds to the premium paid by option buyers for each dollar of notional volume. This premium goes to the sellers, so it is not revenue for @DeriveXYZ.
The protocol’s revenue comes from trading fees, and it was around $575,000 over 30 days in early October.
More volume with lower premiums is, in principle, a good sign for the platform’s liquidity. But this decline can have several explanations:
◻️ The first is the one Derive puts forward. With portfolio margin, market makers lock up less collateral, which allows them to quote more strikes, with tighter spreads.
◻️ The second is a drop in implied volatility across the entire market. In that case, options are cheaper everywhere, and Derive has nothing to do with it.
◻️ The third is a shift in the type of options being traded. Short expiries and strikes far from the price (OTM) carry a lower premium per dollar of notional. If a larger share of volume has moved toward these options, the average cost automatically falls.
To know which one is right, you would need to compare with @DeribitOfficial over the same period. If the decline also shows up on Deribit, the market is probably what explains the figure.
If it is specific to Derive, it is more likely a sign that its margin engine is working.
The problem is that this comparison is not publicly available anywhere for now. This figure is therefore encouraging, but it is not yet enough to prove that Derive makes options cheaper.
We break it all down in our full article, available below 👇


🟣 Why are options getting cheaper on Derive while volume is exploding?
In Q3, Derive processed $7.5 billion in notional volume, up 89.5% from the previous quarter. Over the same period, the cost per dollar of exposure fell by 25.6%, to 235 basis points.
As a reminder, this cost corresponds to the premium paid by option buyers for each dollar of notional volume. This premium goes to the sellers, so it is not revenue for @DeriveXYZ.
The protocol’s revenue comes from trading fees, and it was around $575,000 over 30 days in early October.
More volume with lower premiums is, in principle, a good sign for the platform’s liquidity. But this decline can have several explanations:
◻️ The first is the one Derive puts forward. With portfolio margin, market makers lock up less collateral, which allows them to quote more strikes, with tighter spreads.
◻️ The second is a drop in implied volatility across the entire market. In that case, options are cheaper everywhere, and Derive has nothing to do with it.
◻️ The third is a shift in the type of options being traded. Short expiries and strikes far from the price (OTM) carry a lower premium per dollar of notional. If a larger share of volume has moved toward these options, the average cost automatically falls.
To know which one is right, you would need to compare with @DeribitOfficial over the same period. If the decline also shows up on Deribit, the market is probably what explains the figure.
If it is specific to Derive, it is more likely a sign that its margin engine is working.
The problem is that this comparison is not publicly available anywhere for now. This figure is therefore encouraging, but it is not yet enough to prove that Derive makes options cheaper.
We break it all down in our full article, available below 👇
🟣 Aave announces the launch of the first markets curated by an external player on its V4
This is one of the main new features introduced by V4. With the Hub & Spoke architecture, deposits are pooled in Liquidity Hubs, and each market (Spoke) borrows from them with its own collateral and its own risk rules.
This model now allows independent risk managers to deploy their own Hub on Aave’s infrastructure, and Sentora is the first to do so.
The protocol, aimed at institutions and specialized in designing DeFi strategies, has already allocated more than 2 billion dollars to on-chain strategies, each governed by more than a thousand risk models.
On its Hub deployed on Ethereum, Sentora has opened three markets:
◻️ RLUSD Yield and OUSD Yield, where these stablecoins are borrowed against USDe, PRIME, mWIN or PST.
◻️ Bluechip, which allows borrowing RLUSD, PYUSD or OUSD against kBTC.
@SentoraHQ sets the parameters of its markets, but within the framework defined by Aave governance.
The DAO remains the owner of the contracts, any change that increases risk goes through a 48-hour timelock, and each new asset must be approved before being listed.
The markets are available now on Aave Pro.

The first externally curated markets on Aave V4 are now live, with strategy by @SentoraHQ.
Users can borrow RLUSD, PYUSD, and OUSD against yield-bearing and blue-chip collateral across three new markets on @ethereum.

OAK Research retweeted
🟣 With its V3, Derive is changing the way an on-chain options product is built
The real obstacle to launching an on-chain options application has always been the technical complexity of the project.
A team had to set up a full exchange before being able to offer anything at all, with an order book, a risk engine, a bridge, and above all market makers to convince one by one.
This is precisely what Derive’s V3 now offers to take care of. Derive provides infrastructure similar to a back-end, and the builder only has to design their interface.
To understand what this changes, we need to go back to what a team had to handle with V2. Even when going through the API, it had to request access from @DeriveXYZ to create accounts.
The user ended up on Derive’s interface anyway to open their own, then had to bridge their funds to Derive Chain. In other words, the application lost control of its user before their very first order.
This is the friction that V3 removes, step by step:
◻️ Accounts are created directly by the application, without prior authorization, and the subaccount appears upon the first deposit
◻️ This deposit is made by simply sending funds to an address, with no signature or approval
◻️ With the contracts now on Ethereum, any bridge can be used to reach the L1 before depositing
In practical terms, the user can now do everything from the application they are on, without necessarily knowing that they are using Derive’s infrastructure.
With Builder Codes, even the builder developing their project on Derive comes out ahead financially. In place since February, they allow an application to submit its users’ orders with its own identifier and set its own additional fees, which are paid out to it every month.
There is no exclusivity, no prior authorization, and no minimum volume. The API Broker program comes on top of this, paying out 10 to 50% of net fees depending on volume and stDRV held.
Everything is therefore in place for a team to launch its product without ever having to build the infrastructure it relies on.
For now, only two teams have actually launched their product using Derive as a back-end. There is of course @dreaming, a mobile application that hides all the complexity of options, and @LEVR_money, which is building a 0DTE trading experience.
We break everything down, from the architecture provided by Derive to Builder Codes, in our full article available below 👇
