

Latest RD&E, news and events from the Grains Research and Development Corporation. Region specific accounts @GRDCNorth, @GRDCSouth & @GRDCWest
- Tweets14.3K
- Following4.2K
- Followers25.2K
- Likes11K




ALT A person is using an air blower to clean the rear wheel and machinery of a large industrial vehicle. Dust is visibly billowing from the machinery. The vehicle features large, ridged tires and complex mechanical components.

ALT A person stands at a podium giving a presentation at the Plant Biosecurity Research Symposium 2026. The presentation slide in the background lists topics related to biosecurity and diagnostics. There are decorative plants around the podium.

ALT A group of people dressed for hiking stand together in a wooded area. The image features logos for GRDC and the Australian Rural Leadership Foundation. Text reads: "Growing Grains People. Applications for six GRDC-sponsored positions in the TRAIL Emerging Leaders Program closing soon!

ALT Three people stand in a field of golden wheat under a cloudy sky. They are positioned in a narrow path between the crops. Trees line the horizon in the distance.

ALT A group of people stands in a field, some listening to a speaker. The sky is overcast, and the ground appears muddy. Trees line the horizon in the background.

ALT Aerial view of a vast agricultural field with neatly arranged rectangular plots in varying shades of green and yellow, surrounded by expansive green fields. Trees line the horizon under a cloudy sky.

ALT A hand holding a freshly pulled root vegetable with soil attached, likely a radish, surrounded by several similar vegetables with green leaves on a surface.

ALT A group of people stands in a picturesque rural landscape with fields and hills in the background under a cloudy sky. Most are dressed in casual outdoor clothing.

ALT A group of people stand in a lush green field under a blue sky with scattered clouds. One person is gesturing as if speaking to the group. Everyone is dressed in casual, weather-appropriate clothing, such as jackets and hats.

ALT A group of five individuals stands in a lush green field under a clear blue sky. One person is gesturing, possibly explaining something about the field, while holding a spade. The others listen attentively. They are dressed in casual outdoor attire, and one person wears a wide-brimmed hat. The scene suggests an agricultural setting, and there's a wind turbine in the distant background.

ALT Two individuals are examining crops in a field. One is wearing a blue cap and striped shirt, the other a white and black striped sweater. The setting is a large, lush field with trees in the background under a cloudy sky.

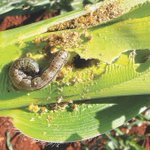
ALT A fall armyworm is on a stalk, causing noticeable damage with several holes and ragged edges. The background shows green leaves and brown soil.

ALT An agricultural vehicle is harvesting wheat in a vast field under a clear blue sky. The image features text promoting a "RiskWi$e Webinar" titled "Making fast harvest decisions, wisely," associated with the National Risk Management Initiative.

ALT Webinar announcement for 'A GRDC RiskWi$e webinar weighing up risky harvest decisions involving logistics, storage, machinery and labour.' Includes guest speaker Ben White, General Manager - Research at Kondinin Group. Scheduled for Friday, 23 October 2026, 12pm - 1pm (ACDT). Features a 'Register Now' button. RiskWi$e logo at the bottom.

ALT A person standing in a lush green field uses a large net to inspect the plants. The sky is clear with some clouds, and there are trees and a telephone line in the background.

ALT Informational graphic titled "Canola: Windrow on Time, Reap the Reward$". The graphic discusses optimal windrowing timing and its benefits, emphasizing the importance of assessing individual seed color change. Key points include seed color change, timely windrowing in southern and western Australia compared to northern and central regions, and the role of sampling in determining timing, utilizing technology like satellite images and NDVI. An image of a canola field is partially visible in the background.

ALT The image is a flowchart titled "Sampling protocol" with four main steps. Step 1: Identify five sampling locations in the paddock. Step 2: Instructions for collecting pods from main stems and branches, shown with colored diagrams. Step 3: Split pods, place seeds in a dish, and spread seeds over an indent paddle. Step 4: Assess seeds using a closest match guide. Diagrams and text offer guidance on sampling, collecting, and evaluating seeds.

ALT Chart illustrating pea maturity and oil content: - Left section: No color change, check in 4-6 days, yield 40-60%, oil decrease 6-8 percentage points. - Middle section: 10% color change, check in 3-4 days, yield 30-40%, oil decrease 4-5 percentage points. - Right section: 20% color change, check in 3-4 days, yield 20-30%, oil decrease 3-4 percentage points. Background shows peas in various stages of ripeness.

ALT A chart titled "Too Early to Windrow" displays three sections indicating different stages of color change in crops: 30%, 40%, and 50%. Each section provides a timeframe for rechecking, potential yield, and oil content. Images below each section show crops at their respective stages of color change: green and orange speckles transitioning in color.

ALT Illustration of a combine harvester diagram labeled with parts like "hopper" and "feedhouse." Text above reads: "HARVEST WEED SEED CONTROL. 50–80% of weed seed capture starts in the header.

ALT A group of people stand in a scenic outdoor setting with tents and camping equipment in a grassy area. Mountains and trees are visible in the background under a clear sky. The image includes logos for GRDC and the Australian Rural Leadership Foundation, and text promoting the 2027 TRAIL Emerging Leaders Program.

ALT Image of a webinar advertisement by GRDC. The image shows damaged plant leaves with brown streaks. Text includes the webinar title: "Net blotch resistance and management: practical insights for 2027," taking place on Friday, 23 October 2026, and mentions the Disease Management Extension Network.


ALT Row of large Kotzur silos under a blue sky with clouds, standing on a gravel surface. A truck is parked near the silos.