

Computer Applications and Quantitative Methods in Archaeology (CAA) 2023 in Amsterdam #CAA2023Ams Account managed by @alex_brandsen
- Tweets578
- Following1.6K
- Followers1.1K
- Likes719


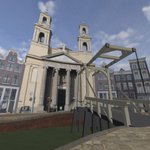




ALT Figure 2 from the manuscript: An example of the 360-degree video in panoramic mode from the site of Delphi. In post processing, this is transformed into a virtual sphere, allowing the viewer to look in any direction, as though standing at the camera’s location.

ALT Figure 2 from the manuscript: Screenshot of the BItFROST platform.

ALT Screenshot of Civilisation V, a historical videogame.


ALT Figure 3 of the preprint: Design of workflow pipeline

ALT Processing for the creation of the 3D model of the Church of Hodegetria and surrounding buildings, align photos (top left), setting marker distances (top right), and views from 3D model of Hodegetria as a mesh (bottom left) and with the texture (bottom right)

ALT Top: Logo of the Clarenet project. Middle and bottom : results from two different machine learning methods tested for the classification of coins in the manuscript.

ALT Figure 8 from the preprint: The optimal paths modelling workflow. Paths formed from the cost of vertical movement according to Equations (1), (2), and (3) across all iterations (n = 5) are combined into an overall suite of optimal pathways. The suite of optimal pathways is converted into a line density raster according to Equation (4).

ALT Figure 6b from the preprint: successful identification of objects using a limited number of higher resolution images

ALT Figure 9 from the preprint: (a) The robot presents a story related to the artifacts. (b) The robots sets questions, related to the artifacts in the surrounding area (c) The screen is also projected on the floor for better visualization of the information.

ALT Figure 5 from the preprint: The Interface setup in the 3D configurator wizard. The panel on the right contains the controls for changing the toolbar skin, setting the viewer background, selecting the tools to enable adding/removing the related buttons in the toolbar, choosing the navigation/orientation widget to add to the 3D scene. The 3D viewer on the left is updated in real time according to the customization in the right panel.

ALT Figure 7 from the preprint: Umm er-Rasas. RGB Colour Composite in false colour of the Pléiades 1A image showing the general view of the Umm er-Rasas area (A), and of the Pléiades Neo-04 image showing a detailed area of the late antique castrum and the Umayyad village (B) (processing and editing by Ilaria Miccoli).

ALT Figure 1 from the preprint: T!O-model - description logic to represent the transformation of organization

ALT Table 1 from the preprint: interrelationships of ARM, digital transformation, and CBSA representations

ALT Figure 4 from the recommended preprint: Overview of a Convolutional Neural Network, its different layers and the additional class layer. (Photo: Corpus Nummorum. Graphic: S. Gampe, Big Data Lab)

ALT Figure 3 from the recommended preprint: View of the reported detections for a set of calibration runs on a field seeded with artifacts relevant to a forensic search (backpacks, fabric pieces, eyeglasses, shoes). Note the considerable spread in range, due to surveyors’ innaccurate estimates of distance.

ALT Figure 1 from the preprint: Conceptual model of the construction of social space through the acts of spacing and synthesis according to Martina Löw (2016). Created with diagrams.net.

