

YouTube (169.000) | Owner Gerla Whale Group | NFA
Dubai
Joined April 2018
- Tweets14K
- Following301
- Followers33.7K
- Likes9.4K

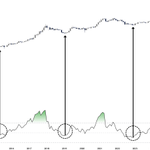






Every $BTC cycle low came with the same monthly RSI behavior, four times in a row.
Now it’s showing up again.
Why wouldn’t it work this time?

Zoom out far enough and the panic looks silly.
$BTC is back on the Power Law floor, the same line that held at every cycle low.
I’m not selling here.

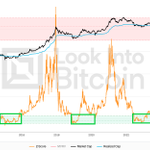
When $BTC VDD Multiple goes this quiet, it's worth paying attention.
It's back near levels seen around previous cycle bottoms.

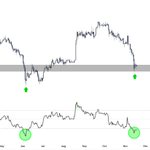
$ETH is back at the same support zone that triggered major bounces in February and June.
RSI is deeply oversold. Another major bounce could be loading.

$BTC 4-year cycle is still playing out.
Historically, this phase has marked the beginning of major long-term opportunities.

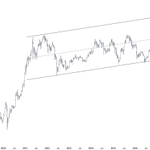
$ETH is back at the lower support of its 5-year rising channel.
Every major touch since 2022 has led to a strong bounce.
My target remains $10K.
Buy the fear. Giga bullish.

Long-term Bitcoin holders are realizing losses again.
2018. 2022. 2026. The same capitulation pattern has appeared at previous cycle lows.
The next major recovery could unfold in 2027–28.

$ETH is showing a classic bullish divergence on the daily, with money flow near oversold levels.

$BTC MVRV Z-Score is back in the historical bottom zone, just like 2015, 2019 and 2022.
These levels have marked major accumulation phases in previous cycles.

Bitcoin dumped nearly 30% ahead of the SpaceX IPO. Now it's repeating almost the same move ahead of Anthropic.
SpaceX window: -28.24%
Anthropic window: -27.25%
Both measured over 30 days.
Last time, $BTC bottomed after the IPO and went on to recover.
Could we see another bottom after Anthropic's listing before the next major recovery?
$BTC touched the 8-year trendline for the third time.
December 2018 was the bottom. November 2022 was the bottom. Monthly RSI is back in the same zone.
History is lining up again.
Another major cycle bottom could be forming.

$XRP has printed a bullish RSI divergence on the weekly chart.
A major reversal could be getting started, with $1 as the first level to reclaim.

$BTC daily RSI has hit the oversold zone for the 4th time in a year.
The previous three signals came before rallies of 21%, 37% and 50%.
Now the same pattern is showing up again.
The next major move could be much bigger than most expect.
$BTC is now around day 940 after the halving.
In 2016 and 2020, this was the bottom zone before major recoveries.
History is lining up again. The next major move could be much bigger than most expect.

The downside sweep has cleared most of the longs.
$BTC has liquidity stacked overhead, setting the stage for a potential short squeeze.


Capital is leaving crypto, but look at the trend.
In 2022, net outflows hit -$25B, then started shrinking as the bottom formed.
In 2026, outflows hit -$30B and are shrinking again, even as prices fall.
Selling pressure is fading before price shows it.
It’s happening again.

The US midterms just passed.
Look at the last three: 2014, 2018, 2022.
$BTC bled the year before, bottomed around the midterms, and recovered after.
Now it’s 2026, and BTC is at $65K with everyone scared.
Even if we see another post-midterm correction, the bigger picture remains bullish.
This could be the final shakeout before Bitcoin's next major rally.
