
Senior researcher in computer science (networking, mobile and pervasive computing, distributed systems) and lecturer at the University of Stuttgart; maker
Stuttgart, Germany
Joined July 2016
- Tweets118
- Following36
- Followers33
- Likes10

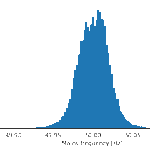
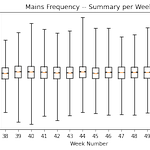

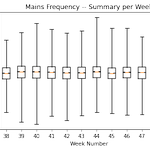
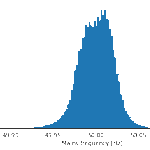
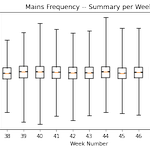
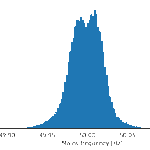

Time for a short summary of the mains frequency measurements of 2022. As shown by the following box plot, there is no indication of a critical deviation from the 50 Hz nominal frequency, "critical" defined as being outside the range [49.8 Hz, 50.2 Hz].

Mains Frequency (f) -- Summary Week 51/2022:
min(f) = 49.889 Hz
max(f) = 50.109 Hz
mean(f) = 50.0006 Hz
99 % confidence interval of the mean = [50.00059 Hz,50.00063 Hz]

Measured in Southern Germany (Plochingen).
Disclaimer: these numbers have been provided by a private user, hoping they are interesting to the community, but without implying endorsement of any third party.
All measurements are available at: doi.org/10.5281/zenodo.74916…

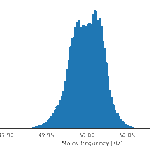
Mains Frequency (f) -- Summary Week 49/2022:
min(f) = 49.898 Hz
max(f) = 50.115 Hz
mean(f) = 49.9998 Hz
99 % confidence interval of the mean = [49.99981 Hz,49.99985 Hz]

Measured in Southern Germany (Plochingen).
Disclaimer: these numbers have been provided by a private user, hoping they are interesting to the community, but without implying endorsement of any third party.
All measurements are available at: doi.org/10.5281/zenodo.74515…
How to interpret these numbers:
+ Normal operation area: [49.8 Hz,50.2 Hz]
+ Minimum/maximum instantaneous frequency after loss of generation/load: [49.2 Hz,50.8 Hz]
Higher deviations lead to load shedding and possible grid failure (#blackout).
Mains Frequency (f) -- Summary Week 48/2022:
min(f) = 49.893 Hz
max(f) = 50.098 Hz
mean(f) = 50.0003 Hz
99 % confidence interval of the mean = [50.00025 Hz,50.00029 Hz]

Measured in Southern Germany (Plochingen).
Disclaimer: these numbers have been provided by a private user, hoping they are interesting to the community, but without implying endorsement of any third party.
All measurements are available at: doi.org/10.5281/zenodo.74018…
How to interpret these numbers:
+ Normal operation area: [49.8 Hz,50.2 Hz]
+ Minimum/maximum instantaneous frequency after loss of generation/load: [49.2 Hz,50.8 Hz]
Higher deviations lead to load shedding and possible grid failure (#blackout).
Mains Frequency (f) -- Summary Week 45/2022:
min(f) = 49.897 Hz
max(f) = 50.114 Hz
mean(f) = 49.9983 Hz
99 % confidence interval of the mean = [49.99832 Hz,49.99837 Hz]

Measured in Plochingen, Germany.
Disclaimer: these numbers have been provided by a private user, hoping they are interesting to the community, but without implying endorsement of any third party.
All measurements are available at: doi.org/10.5281/zenodo.73248…
How to interpret these numbers:
+ Normal operation area: [49.8 Hz,50.2 Hz]
+ Minimum/maximum instantaneous frequency after loss of generation/load: [49.2 Hz,50.8 Hz]
Higher deviations lead to load shedding and possible grid failure (#blackout).