

The world’s most-cited journal in multidisciplinary physics.
- Tweets5.6K
- Following168
- Followers75.4K
- Likes707
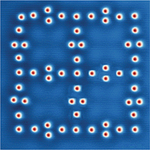





ALT Scanning tunneling microscope image showing 57 iron (Fe) adatoms arranged in a cluster-decorated Lieb lattice on a silver (111) surface.

ALT At the top is a front-on sketch of two slightly mismatched lattice chains, one blue and one pink, stacked one on top of the other. Below that is a top view of the same chain: Blue is always visible, but pink peeks out from beneath the blue in an oscillating pattern because of their mismatch. Below that is the wavefunction of the state plotted three times with different offsets between the blue and pink. At the bottom is a similar pattern, but extended to two dimensions. Here, diagonal areas of only-blue clearly emerge, which are the transport channels of the pump.

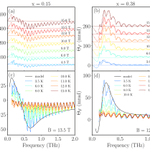
ALT A series of four graphs labelled a-d, each plotting the magnetic field and temperature dependence of Faraday rotation spectra of FeTe1−xSex superconducting films. Each plot contains frequency in THz on the x-axis and ΘF in mrad on the y-axis. Panels (a) and (b) show charts corresponding to x = .15 and x = .38, respectively. Panels (c) and (d) show the temperature dependence measured at 13.5 T and 12 T, respectively, for x = .15 and x = .38. All of the charts contain seven or six functions of varying colors, corresponding to a range of values of T (for a and b) and K (for c and d). Panels (c) and (d) also contain black lines corresponding to the model.

ALT Two images above one another: The top image is the cross-sectional SEM image of the fabricated binary grating. A scale bar shows 2 μm. The lower image gives a chart showing normalized angular line cuts at four representative wavelengths–from top to bottom, red (660nm), green (565nm), cyan (495nm) and dark blue (440 nm)–vertically offset for clarity. The vertical axis for each line cut shows normalized intensity, running from 0 to 1, and the horizontal axis shows degrees from -60 to 60. All lines show the same strong peak at roughly -45 degrees, and then gentler peaks at larger angles.

ALT A 3D rendering shows a cutaway of a gold-colored cylindrical Penning trap with a single positron, a red sphere labeled "e⁺," at its center. Blue arrows on both sides point down, marking the magnetic field. Below the trap, a plot of time from 0 to 30 seconds shows black data points on a lower dashed line that jump to an upper dashed line at about 14 seconds and drop back at about 24 seconds. Small level diagrams at left show the positron jumping to an excited cyclotron state and back.

ALT A topographic image of one of the cluster-decorated Lieb lattices used in the paper. The lattice appears as a series of red dots (iron atoms) arranged in a square cluster-like pattern on a dark blue surface (silver substrate), with several blue dots linked by white lines interspersed within.

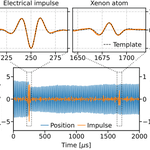
ALT At the bottom, the figure displays a plot that charts the z-position of the nanosphere (series of vertical blue lines) and the reconstructed impulse amplitude (series of smaller vertical orange lines) over a 2ms window. Time is on the x-axis, and z position and impulse are on the y-axis. At the top, two smaller graphs show enlarged sections of the main plot, corresponding to two impulse events. The top-left graph displays electrical impulse and the reconstructed wave form. The top-right graph displays the reconstructed wave form from a candidate collision event with a Xenon atom. In both graphs, a dashed black line represents the signal template.

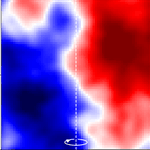
ALT Color map of Planck cosmic microwave background temperature data from 25 galaxy clusters, with blue and red regions showing opposite sides of a dipole signal. A dashed vertical line marks the center, with an oval highlighting a region near the bottom.

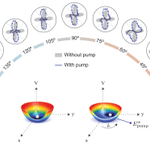
ALT A graphic visualizes the optical poling of polar nanoregions in the disordered phase. The visual’s center displays two rainbow-colored hemispheres, which contain small dips arising from the bottom. These half-spheres are laid out on an x-y-V axis, with a black curved line representing the varying polarization directions (δ) and a blue line representing Eωpump. A half-circular array of small circular plots surrounds the rainbow hemispheres, spanning from an angle of 180 (left side) to 0 (right side). The plots represent the RA-SHG patterns acquired with an optical pump, with blue empty circles on the plots representing raw data and blue curved lines representing the best fits to simulations. Gray shaded regions on the plot denote patterns acquired without pump.

ALT Schematic of the spin and orbital Seebeck effects in a vertical multilayer device. An x-y-z axis is shown to the left. From top to bottom (z axis), the layers in the stack are a heater (top yellow layer), SiO2 insulator (green), a gap then Au (yellow), Ti(t) (blue), Ni (yellowy-green), and a substrate (light blue) at the base. The top heater carries a current Idc. Arrows pointing to the right (+y direction) are labeled as currents Jc, while a red arrow labeled Js points up (+z direction). There is a voltage V(H) across the Ni layer. A field H is depicted by a green arrow (+x direction). A vertical thermal gradient (∇T), pointing up (+z direction), generates a spin or orbital accumulation, which is injected from the Ni layer into the detection layers. There are accumulation labels AL A’L near the Ti/Ni interface.

ALT Panel (b) on the left displays the photoelectron energy spectra as a function of time delay (τ) between the XUV-APT and IR fields. Time-delay is on the y-axis and SB24 is on the y-axis. The graph comprises 13 bursts which appear as a series of vertical red bars separated by wider white regions. The spectra are labelled with a color scale bar at the top, ranging from white for the lowest values to dark red for the highest values. On the right, panel (c) displays a simple graph plotting the normalized oscillation of SB24, which is visualized as a dashed box in panel (b). The graph displays a black solid curve, oscillating from the bottom of the y-axis to the top. The curve contains various red dots, which represent data points.

ALT The top of the figure displays a chart visualizing Planck cosmic microwave background temperature data on 25 galaxy clusters. x/R500c is on the x-axis, and y/R500c is on the y-axis, with each side ranging from values of -1 to 1. The graph’s regions are labelled with a color scale bar on the right, ranging from dark blue for the lowest values to dark red for the highest values. The left side of the chart is primarily blue and the right side is primarily red, with a thin band of white separating the two regions. A dotted white line runs down the middle of the plot. The bottom of the figure shows a plot visualizing the significance of the dipole compared with a random noise distribution.〈D〉[μK] is on the x-axis, and probability is on the y-axis. A series of grey bars along the x-axis represents the distribution of randoms. A black dashed line running along the distribution shows the best-fit Gaussian to the noise, while a vertical solid red line shows the oriented stack.

ALT Photograph of the helicon traveling wave antenna used in the experiment. The device is mounted on a wall with gray metallic panels, protruding slightly. The center of the device contains multiple columns of thin, rounded bars stacked in a slightly off horizontal orientation.

ALT A simulation of plasma accreting onto a central spinning black hole. The black hole appears as a black circle at center; the right side shows particle number density, while the left shows the out-of-plane magnetic field.

ALT A graph plotting the transient shear and planar extensional viscosity for the linear PTT model as a function of accumulated strain. The graph plots two functions, visualized as a series of connected black diamonds and red circles, respectively. Black dashed lines plot the predictions of the UCM model.

ALT A figure displaying two models of the atomic and magnetic structure of HoIG under scenarios of above TM (left) and below TM (right). The structures consist of lattices and fields of various molecules, including Ho3+ (purple spheres), Fe3+tet (pink spheres), Fe3+oct (yellow spheres), and O2- (red dots). The left model displays the molecules arranged within a black outline of a cube, and includes several pink, purple, and yellow tetrahedrons in the middle. The right model displays the same molecules in a more compressed rectangular sphere, with dark and light purple arrows indicating canting angles from the ⟨111⟩-axis.

ALT Artist’s conceptualization of the acousto-mechanical interaction within the acoustic drumstick device. A blue translucent cylinder represents a piezoelectric layer. High-frequency bulk acoustic waves are excited through this layer, shown by multicolored chevrons, creating ripples, which are converted into photons, that strike a micro-drumhead membrane suspended below. The acoustic wave acts as a nanoscale "drumstick" striking the mechanical membrane, creating large ripples, illustrating the energy transfer between sound and motion.

ALT A 3D rendering of strong-field ionization with bright squeezed vacuum. On the left is a thick, salmon-colored beam intersected with a transparent disc and two white squares. Towards the right, the salmon beam becomes a thinner orange beam intersected with a diagonally oriented transparent square with a black knob. The orange beam then gets reflected and focused by a metallic cylindrical shape onto a separate, light blue rod with dark blue spheres attached to it, representing the jet of xenon atoms. The light blue rod has a blue coil hanging off of it that touches a metallic disc with a black outline lying flat below.

ALT A line-art portrait illustration of Francis Halzen with gold accents, created by Niklas Elmehed. Below the illustration, a dark red banner displays his name, "Francis Halzen," along with the award citation: "for decisive contributions to the IceCube Neutrino Observatory and the discovery of high-energy neutrinos of astrophysical origin". At the bottom, text attributes the award to the Royal Swedish Academy of Sciences.

ALT Front cover of the journal Physical Review Letters, Volume 111, Number 2, published July 12, 2013 by the American Physical Society. The top portion features green geometric stripes framing the issue number "111" and the journal title. The center displays a scientific visualization composed of vertical wave-like patterns made of colorful, semi-transparent spheres and spindle-like columns in shades of green, yellow, orange, and blue set against a light cream background.

ALT General relativistic particle-in-cell simulation of a collisionless plasma — represented by blue, purple, and orange — accreting onto a central spinning black hole in the center.