

Escaped the 🐀 Race (Retired at 39) Family | Bitcoin | Freedom Maxi | Check out https://xitter.cf/t.co/vV2M2WKfD1 the best tools ⚒️ for Bitcoiners.
Cyber Manhattan
Joined May 2017
- Tweets135K
- Following5K
- Followers16.2K
- Likes412K








AA ⚡️ retweeted
🟠 Daily Bitcoin Report October 22, 2026
📊 PRICE ACTION
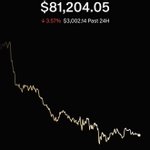
Open: $84,023 | High: $84,294 | Low: $80,836 | Current: ~$81,109 | Change: −3.47%
The breakout lasted one day. Price touched nearly $85,000 overnight, then round-tripped $3,458 to $80,836, the widest range of the entire stretch. Yesterday's close at $84,676 is gone, and so is the $84,062 ceiling it cleared.
📈 TECHNICAL READ
Trend Exhaustion: 59, down from 78. Momentum spent on a move that gave everything back.
The level that matters: the close at $81,109 sits below the $81,500 ETF cost basis. If it holds through the daily close, it's the first one since Sep 21. Caveat, your chart still had three hours left on the candle, so that isn't settled yet, and $391 below is marginal rather than decisive.
Support: $80,836, then $80,200, then $79,898 (lower band). Resistance: $83,002 (the 20-day), then $84,294.
🔍 ON-CHAIN
→ Glassnode has been explicit about this line: a decisive close below the ~$81,500 ETF cost basis opens a path toward the $70,000 range. Price is testing it right now.
→ Beneath it the levels come fast: $80,200 is the average cost of public corporate treasuries, $80,000 was Binance's largest spot bid cluster, mostly consumed in the Oct 15 selloff, with only smaller bids rebuilt since and $79,600 is a liquidation cluster. Below all of it, True Market Mean at $77,600.
→ Here's the uncomfortable part. ETFs bought more than $1B in three sessions $526.7M Monday, $23.2M Tuesday, $528.4M Wednesday (IBIT $235.0M, FBTC $212.7M) and price still broke down. Over a billion dollars of institutional bid didn't hold the level.
→ $431M liquidated in 24 hours. Shorts paid $173M on the way up; in the last twelve hours, $210M of the $222M wiped was longs. The largest single hit was an $11.8M bitcoin long on Binance near $83,500. Both sides got burned.
→ Overhead supply now starts at $86,700 the 6–12 month cohort's cost basis.
📰 TODAY'S NEWS
1/ Tech cracked again. Tesla cut its spending forecast and Lam Research guided weak, sending Nasdaq 100 futures down 1.1%. The same AI trade that carried bitcoin up on Wednesday carried it down on Thursday.
2/ Tomorrow brings flash PMIs at 9:45am and the final University of Michigan inflation expectations at 10:00am. With the Fed six days out, inflation expectations are the number that can move the hike odds.
⚖️ WHERE WE STAND
Yesterday I put up a board calling $87,165–$87,700 the only level that mattered. Price never got within $2,300 of it, it reversed from $84,843 and gave back the entire breakout in a session. Worth owning directly: the move I described as a breakout was a bull trap, and the $84,06x level I called new support failed the next day. What that leaves is a market that absorbed over $1B of ETF buying in three sessions and still couldn't hold $82,000. That's the signal. When institutional flow that size doesn't defend a level, the level isn't being defended by anyone else either. Everything now hinges on where this daily candle actually settles against $81,500, above it and this is another wick in a two-week range; decisively below and the map thins out fast, with $80,200 and $79,600 the only real stops before $77,600.

AA ⚡️ retweeted

Every pref issuer is underwriting a BTC CAGR that exceeds the cost of the preferreds. CEBE checks the tape and shows where they stand
cebetracker.io/spread


Every preferred issuer is underwriting a Bitcoin return. At minimum, Bitcoin has to beat the rate on the preferred that funded the purchase
How have they done?
As of Oct 20, Bitcoin is behind the rate on all 7 series measured since launch
It moves with price. Today it’s 0 for 7
cebetracker.io/spread/

AA ⚡️ retweeted

Pivot @Strategy $600 MSTR stock price needs 2.09X NET mnav. grainofsaltsf.com/mstr-1000?…

