

Stop reading RSI through fixed 70/30 levels. RSI as position. Adaptive zones. Price levels. RSI Manifesto: https://teapawt.org/t.co/omJNWejPrF DMs open.
Poland
Joined September 2025
- Tweets488
- Following214
- Followers939
- Likes184






Pinned Tweet
Is there a robust way to measure how far price deviated from its moving average?
Percentage envelopes don't work the way you'd think.
Neither do Bollinger Bands.
Here's a scale that actually accounts for both market and lookback.

Deep dive into the true (and suprising) geometry behind RSI 👇
youtu.be/uPOwLU7wICY?si=lIHt…
Stop checking RSI in the lower pane.
The trade happens on price — so put 70/30 (or 60/40, 80/20…) directly on the chart.
Short tutorial showing exactly how:
youtu.be/z3Kqsd_prOo
Free RSI Chart Overlay script:
tradingview.com/script/ZgFgK…
1
4
459
Warning: not a short read.
A full TradingView idea that walks through the modern way to read RSI.
👇
tradingview.com/chart/NQ1!/B…

💡 There’s more structure here than a simple EMA trick.
The exact algebra is:
Wilder EMA(n) = regular EMA(2n−1)
therefore for RSI:
RSI(n) = 50 ↔ price = Wilder EMA(n) = EMA(2n-1)
But 50 is only one coordinate.
So instead of treating other RSI levels as individual price predictions, we can map them as volatility channels around the Wilder EMA.
This is what RSI Chart Overlay script does:
tradingview.com/script/ZgFgK…
That connection between RSI space and price space is much deeper than it first appears.


🔥 RSI EXPONENTIAL SMOOTHING - TradingView Indicator
📊 Friends, most traders flip between RSI and price charts to spot momentum shifts, so they miss how a simple EMA cross can show the exact same signal directly on price.
🧠 Plots RSI behavior as moving averages directly on your price chart
⚡ Used by traders to read RSI signals without leaving the price pane
🔄 EMA line that mirrors the RSI 50 cross, so a close above or below it equals RSI crossing 50
🎯 Overbought and oversold bands plotted directly on price, no separate oscillator needed
🛡 FIB Bands setting that plots short term support and resistance zones for scalping
📈 Bounce reactions off the EMA line that mark the same rejection you would see at RSI 50
Give it a go on your charts, it might just change how you read price action.
Thank you all for the incredible support, this community keeps pushing us to build better tools for you.
TradingView script: tradingview.com/script/OhFeq…
Full Suite: zeiier.com/2a6exp4
#TradingView #RSI #EMA #Scalping #PriceAction #TechnicalAnalysis

After looking deeper into TradingView’s new $29.95 per-user Technology Fee, I suspect this is about a broader platform strategy.
TradingView is gradually building a closed ecosystem covering market data, research, charting, AI tools, broker execution and now creator monetization.
Paid Spaces brings discovery, checkout, billing, taxes, renewals and access management directly into TradingView.
External invite-only vendors use the platform’s infrastructure while keeping the commercial relationship outside it. Section 22A makes that model increasingly uneconomic above 100 active users and creates a clear incentive to move toward the native marketplace.
Interestingly, the 100-user threshold leaves the door open for new developers to test selling access to their work. Once they approach the limit, applying to join Paid Spaces becomes the natural next step.
The recent Senior Director, Market Data vacancy points in the same general direction: tighter control of pricing, licensing, professional classifications, audits and overall data economics. It doesn’t prove that everything is part of one coordinated plan, but the pieces fit.
There may eventually be another step: cleaning up the public script library. TradingView already has strict publication rules, yet the library remains full of trivial variations, with AI making mass production even easier. A stronger curation layer would probably help, although there is no sign of a broad cleanup yet.
My current reading: this is not about ending paid indicators. It is about ending free, large-scale commercial use of TradingView’s infrastructure and moving serious creator businesses onto TradingView-controlled rails.

I don't have IO indicators, but i know a few who do and don't charge for them
This is a terrible move from TV, but not surprising...they've made it increasingly more difficult to publish publicly, privately and now IO
If anyone has suggestions for alternative platforms that allow you to build and publish custom indicators, drop them below
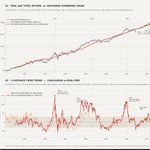
The +56% deviation from trend and 6.6% slope are fine as a full-sample description.
But it is not what 1929, 1966 or 2000 looked like in real time.
Those dates did not have the later decades that now set the slope.
Anchored expanding-window fit from 1881. Same series, no look-ahead:
--> 1929 +150%
--> 1966 +102%
--> 2000 +109%
--> today +56%
Today both measures meet, because the window has become the full sample.
That is the only date on the original line that could have been drawn at the time.
@grok, thanks for redrawing it.


As of September 2026, the S&P 500’s real total return stands +56.2% against its 145-year trend line, which grows 6.6% a year after inflation. Against the trend fitted from 1926 it is +39.6%.
The market might need to go through an Euphoric blow off top to form another major peak similar to 1929 and 2000.

1
9
971
AdaptiveRSI retweeted
It's 2026. You can plot RSI as:
--> candles,
--> bars,
--> Heikin-Ashi.
tradingview.com/script/CMBt4…
It's 2026. You can plot RSI as:
--> candles,
--> bars,
--> Heikin-Ashi.
tradingview.com/script/CMBt4…

Stop treating every RSI the same way.
Length completely changes the picture.
The free 38-page Manifesto shows the proper map instead of the old 70/30.
Download:
adaptiversi.gumroad.com/l/ev…

RSI above 50 means price is above the same-length Wilder EMA.
Below 50, below it.
The good old RSI(14) you already use.
Same values, different meaning.
Refreshed the old walkthrough:
youtu.be/rE39tPqsFGI?si=_emI…
🧵(1/4)
Most people use RSI as a loose label: high, low, overbought, oversold.
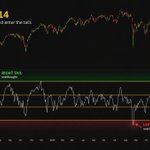
But once RSI is standardized, a better question appears: not “Is RSI high?”, but “What state is the market in?”
That is the bridge to something more useful.
A standardized RSI reading can define a state in a repeatable way, and a repeatable state can be tested.
#AdaptiveRSI

🧵(3/4)
This is the key step: a state is not a signal. A state is a research condition.
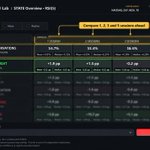
Once the condition is defined, I can pull all historical NQ daily RSI(5) right-tail events and compare what happened next versus all observations.
That is when indicator talk stops being vague. We now have a clean sample, a baseline, and a question:
what usually happened after this specific state?

1
1
74
🧵(4/4)
That is the full logic behind the Lab.
The chart gives me the condition. The standardized scale makes it comparable. The Lab checks whether forward outcomes after that condition looked different from baseline.
If you want, load Logit RSI, pick a market, timeframe, RSI length and one of the five states, then post the chart below or tag @AdaptiveRSI
I’ll run a few through the Lab and share the results.

47
🧵(1/5)
Standardizing RSI solves the scale problem, but it creates a new one:
a trader still has to decide what z = 0.4, 1.2 or 2.8 actually means on a chart.
I find it more useful to turn that continuous scale into five states.
#AdaptiveRSI

🧵(4/5)
On RSI(14), ±0.66 maps to about 59.1/40.9, while ±2.14 maps to about 76.6/23.4.
Those are only the RSI(14) translations.
Change the RSI length and the raw numbers move.
The standardized boundaries stay fixed.
1
109
🧵(5/5)
This is the bridge to the AdaptiveLab.
“RSI = 70” is length-specific“
right shoulder” is defined in standardized space.
Load Logit RSI
the default ±0.66 and ±2.14 lines already show all five states.
Post a chart and tag @AdaptiveRSI
tradingview.com/script/yGKf9…

1
100