
Enterprise Data Management & AI. From data strategy to AI in production
Joined February 2018
- Tweets176
- Following84
- Followers17
- Likes0
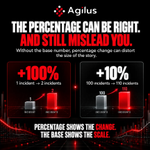






A percentage can be completely accurate and still create the wrong impression.
A 100% increase sounds dramatic. But if something moves from 1 incident to 2, the absolute change is only one.

A large percentage change from a very small base can attract disproportionate attention, while a modest percentage change across a large base may represent a much greater business impact.
The number changed. But understanding that movement requires more than simply reporting the result.
If revenue increased by 12%, leadership knows what happened, but that headline figure does not automatically explain why it happened.

If the improvement came primarily from a price increase or a one-off transaction, the same growth strategy may not be appropriate.
This is where executive reporting needs to move beyond showing performance and start explaining it.
The warning was there.
The problem was that it looked like everything else.
When dashboards give every metric the same visual weight, leaders are forced to search for what matters instead of being guided towards it.
Material risks should stand out.
Emerging issues should attract attention before they become obvious problems.
Good reporting does not simply show leaders what is happening.
It helps them understand what deserves attention first.
Executives rarely suffer from a lack of information.
The harder problem is knowing which information actually deserves attention.

If a metric changes but nothing about the decision, action or behaviour changes with it, its value to the executive conversation may be limited.
The goal is not to show leadership everything the organisation knows.