Cross-Platform Data Visualization Tools 📊 JavaScript charts 📈 Qlik extensions ➕ more for #DataViz and #Analytics ✨ #qlik #javascript #frontend #webdev

Joined April 2009
Include

Only show posts containing:

Exclude

Hide posts containing:

Time range
-
Minimum likes
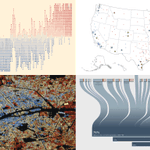
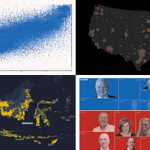
A chart can look great and say nothing. The ones that stick with us do the work. #DataViz Weekly on our blog features that kind, made by others. New picks: 📌 Cyber risk by U.S. industry 📌 Fight for Congress 📌 Michigan debate on X 📌 Every dog in NYC anychart.com/blog/2026/10/23…
2
99
AnyChart JS 9.0.0 is out. It's a big one for new chart types. We've added 7, each for a specific job: » Dependency wheel & arc diagram: connections » Org chart: hierarchies » Stream graph & waffle: composition » Lollipop & dumbbell: comparisons And there's more. Give it a try.
1
106
A "quick" glance at a chart. Ten minutes later, you're still looking. In DataViz Weekly, you'll find more like that, made by others. This time: 🟧 U.S. House battlegrounds 🟧 China's unused wind & solar 🟧 Paris buildings by age 🟧 Pacific sea temperatures anychart.com/blog/2026/10/16…
1
5
237
Check out both editions of DataViz Weekly at anychart.com/blog.
1
44
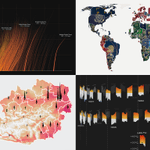
Saw a great chart last month? Can you still find it? #DataViz Weekly gathers examples like that. Latest two editions: » Problem gambling » U.S. school fixes » Earth's terrain » Every Berlin vote » Afterlife beliefs » Tariffs in Canada » Population pyramids » U.S. social life
1
1
6
262
Replying to @bycluster
Our Qlik extensions look right at home. Thanks, team! 🙌
6
AnyChart retweeted
One Qlik tenant, two fully customized hubs. Different brands, different content, same source, no duplicated apps. That’s NewHub for Qlik Cloud, now running @AnyChart's own environment. Want to poke around? DM me and I’ll send you access.
1
1
1
56
3
202
Check out the latest edition of DataViz Weekly and start wherever you like: anychart.com/blog/2026/09/18… Kudos to the creators! » The Economist » Reuters: @prinzmagtulis @annsaphir » Block and Paper » SeasonMap
1
50
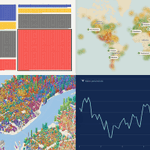
Everyone is busy making charts... Hey, wanna stop & look at anyone else's? That's the point of #DataViz Weekly, our standing roundup of good data viz. This time: » U.S. voters ahead of midterms » U.S. economy's mixed signals » Building ages, 100 cities » Travel weather worldwide
1
1
4
191
AnyChart retweeted
Would you investigate a 22% KPI miss before a 4% miss? Suppose the 22% has run all year and the 4% just started. Only one of them is new information. 🔥 New guide to chart types for performance against target, the question each answers & the trap in each anychart.com/blog/2026/09/16…
2
3
106
Would you investigate a 22% KPI miss before a 4% miss? Suppose the 22% has run all year and the 4% just started. Only one of them is new information. 🔥 New guide to chart types for performance against target, the question each answers & the trap in each anychart.com/blog/2026/09/16…
2
3
106
Good data viz appears constantly. How much of it reaches you? #DataViz Weekly is our regular pick of what we found most interesting. This time: ◉ Hotter days by county 🇺🇸 ◉ Passports compared 🌐 ◉ Heat & hospital deaths 🇦🇹 ◉ Hajj dates & Makkah heat 🇸🇦 anychart.com/blog/2026/09/11…
1
4
149
AnyChart retweeted
Most BI dashboards report what happened. Almost none are built to answer why. Seven charts do that second job. And you rarely use just one. 💥 Just published a guide to chart types for root cause analysis, including the ways each one can mislead: anychart.com/blog/2026/09/02…
1
2
188
AnyChart retweeted
since you guys loved the exploding tesla.. I used GPT-6 Astra to create a 3D website that pulls apart the male anatomy into 2,234 modeled pieces! we are in a renaissance of learning
1,152
5,420
1,026
53,308
8,043,694
Explore all four in the latest edition, with a closer look at the visuals and where to explore the originals: anychart.com/blog/2026/09/04… Have a data viz project to share? Send it our way for a future edition 🤝
77
Your next chart could start with someone else's. DataViz Weekly brings you recent visualization projects as examples for your own work. Latest picks: ◆ Record U.S. heat & humidity ◆ How much of the web is AI ◆ Wages in Big Macs ◆ Premier League shirt sponsors
1
2
234
Most BI dashboards report what happened. Almost none are built to answer why. Seven charts do that second job. And you rarely use just one. 💥 Just published a guide to chart types for root cause analysis, including the ways each one can mislead: anychart.com/blog/2026/09/02…
1
2
188
Check out the full roundup on our blog - each project up close, plus where to go explore it yourself: anychart.com/blog/2026/08/28… Built a project where the visuals truly bring something out of the numbers? Send it over, it could turn up in a coming edition.
46
Someone already solved the chart problem you're stuck on 💡 #DataViz Weekly is where you can find that work and pick up a few ideas. This time: 📍 AI homework & exam scores 📍 Who in the U.S. isn't working & why 📍 English Premier League jerseys since 1992 📍 NYC trees by genus
1
3
171