

20+ year student of the mkt. Swing trading breakouts from higher lows and tightening ranges on the highest ADR, highest momentum stocks. KK/KQ is the GOAT.
Aberdeen, MD
Joined June 2021
- Tweets8.8K
- Following45
- Followers35.2K
- Likes7.9K
AsymTrading retweeted

I studied Martin Luk's 2026 trades, and the system which won him the USIC and generated +969.8% in 2025, +844.5% through Aug 2026, and 150%+ in Oktober alone.
No 0DTEs. No Options. No futures.
This article will change your trading career.


AsymTrading retweeted
Your trading approach should be based on studying price action tendencies— not just blindly following what someone else says. Here’s why and how I’ve tailored my strategy using specific setups while incorporating additional criteria and execution techniques.
The Importance of Studying Price Action
By studying price action, you can understand the underlying supply and demand dynamics in the market. This helps in identifying strong momentum phases and potential reversals.
Rather than relying solely on theoretical models, observing how price moves in different conditions provides practical insights that can be directly applied to trading.
ADXpress and ADXtender Setups
I use ADXpress and ADXtender setups not because Dr. Schaap recommended them, but because through extensive study, I found these setups effectively identify stocks in strong momentum phases. After hundreds of hours analyzing the price action of leading stocks, these setups stood out for their consistency in identifying stock in strong momentum phases, allowing one to enter and capture powerful trends.
Over time, I’ve validated these setups by seeing their effectiveness in real trading scenarios. This empirical validation is crucial for building confidence in any trading approach.
Customizing the Approach
While ADX concepts excel in capturing trend, momentum, and linearity, they don’t account for other important factors like liquidity, volatility, and relative strength. I’ve integrated these additional criteria into my analysis to create a more comprehensive approach.
High liquidity ensures smoother price movements and easier entry and exit, while volatility provides the necessary price swings for profitable trades.
Personalizing Entry Techniques
I don’t enter trades exactly as Dr. Schaap suggests. Instead, I use the ADXcellence setups as guiderails and apply intraday techniques learned from other traders like Qullamaggie and Kell to fine-tune my entries.
By blending repeating swing trading setups with short-term tactical entries, I’ve developed a hybrid approach that leverages the strengths of both methods.
Embracing Flexibility and Continuous Learning
Trading strategies must evolve with changing market conditions. What worked 20 years ago may need adjustments today. This doesn’t invalidate the original observations but highlights the need for continuous refinement.
My confidence in these setups comes from personal experience and empirical evidence gathered over time. This practical knowledge is invaluable and cannot be replaced by theoretical understanding alone.
Regularly reviewing and adapting my approach ensures that I stay aligned with current market dynamics and continue to improve my trading performance.
Developing a successful trading strategy involves more than just following established setups. It requires studying price action, validating strategies through personal experience, and continuously adapting to market changes.
By integrating the ADXpress and ADXtender setups with additional criteria and personalized entry techniques, I’ve crafted an approach that works well for me. This method may not be perfect, but it has proven effective and continues to evolve as I gain more insights and experience.

AsymTrading retweeted
People get so wrapped around the axle with indicators, but indicators are just tools to assist you. If you strip away all the indicators and just have price and volume, you should still be able to trade your method. I can trade the way I trade with no indicators at all, or I can use a multitude of different indicators and arrive at very similar conclusions.
I tend to use bollingerbands, moving averages, ADX/DMI, and volume buzz. Not because I need these things to trade, but they are certainly useful. Rather than eyeballing 2,000 charts, I can intelligently use these indicators to pull out the specific kinds of situations I'm looking to exploit. Could I manually thumb through 2,000 charts? Sure, I could. In fact, I did that for many many years. I would review several hundred charts every single day and probably 1,000+ on the weekend.
Do I need to do that every night now? No. If I can smartly cut 1,000 charts down to 100, why would I not do that? At this point in my trading career, I know exactly what I'm looking for. At the end of the day, it's not about the indicator (which is just a derivative of price and volume). It's about understanding why you're using the indicators and what they are assisting you with. I use indicators to gain efficiencies in my trading process - not as if they are some magical instrument that tells me how to trade.
Dave Landry's concepts of slope and daylight are super easy to understand and see on a chart. When I'm looking for setups on the hourly chart, I want a strong upslope of the 10/20 EMA and separation between them. This is no different than what the ADX indicator is doing - a strong green over red DI, with an upsloping ADX is indicating the same phenomenon, just using different tools.
Whether using daylight and slope or ADX, these sorts of "first leg up" situations tend to be my starting point. Why? Because this is the strongest evidence of consistent demand. Remember, we want to trade stocks that are showing demand, because this continued demand creates follow-through from our entry and this is what pays us. Once in a stock, we're literally relying on the demand of others. It doesn't matter if I demand a stock or think it's good. I get paid by other people wanting that same stock and continuing to push it higher and higher.
This should seems like a "no shit" concept, but people don't actually understand this to be the case by how they trade. They will buy a do nothing stock showing zero demand, because of the story or "the potential" or some other random reason. And then they sit there with dead money. This is a huge opportunity cost, especially in strong markets when there are stocks actually showing demand.
Find stocks that have shown slope and separation in their 10/20 EMA, ideally with strong volume signatures as well. These stocks should be on your radar while you wait for an entry, whether you use some sort of pullback technique like Landry, or some sort of higher low flag/wedge/triangle/VCP like Qullamaggie or Minervini.


AsymTrading retweeted
With the market in a correction, now's a good time to review the basics of pullback and compression patterns.
Some good resources:
Layman's Guide to Stock Trading by Dave Landry
5 Secrets to Highly Profitable Swing Trading by Ivanhoff
qullamaggie.com/my-3-timeles…
stockbee.blogspot.com/2013/1…
stockbee.blogspot.com/2017/0…
youtube.com/watch?v=dnT8DNFZ…

With the market in a funk, now is the best time to use your downtime to learn.
youtube.com/watch?v=XwH-WB7b…

A few positions going, but minimal exposure. The market is still choppy and participation narrow but slow improvements under the hood.

Market Pulse for Oct 28, 2026 asymtrading.substack.com/p/m… Open Access - Free to all
AsymTrading retweeted
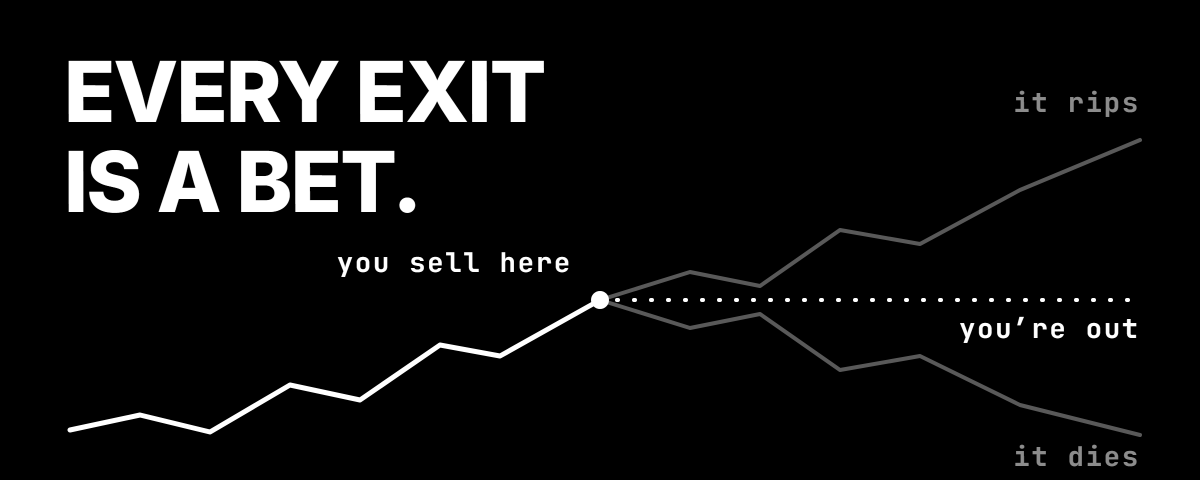
Selling everything at the close of day 5 to day 8 kept 85% to 95% of what the 10-day trail made.
Working on a new article which I think will make most swing traders rethink their sell rules 🧙♂️

AsymTrading retweeted
Your homework this weekend:
1. Scan the weekly charts of the top 10% 1, 3, and 6-month relative strength stocks within 25% of recent highs - 30-day highs, 60-day highs, 52-week highs. It doesn't matter - pick one. The point is that the stock has retained recent momentum. Don't obsess about it. You want stocks with trend, momentum, volatility, liquidity, and relative strength.
Examples:
Trend - xavgc10>xavgc20 and xavgc20>xavgc50
Momentum - c/c60 > 1.30
Relative strength - c/c60 ranks top 10%
Retaining RS - c>maxh60*.75
Volatility (ADR %) - avg((h-l)/c, 20)*100 > 4
Liquidity - avgv20>300000 and avgv20*c>5000000
This is just an example, but offers a simple, scannable way to narrow your universe of stocks down to things with technical potential. If you want to add fundamental criteria to that, be my guest.
2. Flag all the ones with 1-3+ weeks consolidations and are pulled back in the vicinity of their 20-day EMA. If you need help understanding what solid setups look like, then compare those stocks to the model setups in the attached images. There may be none that match. That's ok. It may take another week or four. You'll track these stocks until they look like the picture - or shit the bed and break through the MAs. These are setups, not buys. They only become buys once they break through the pivot on solid price/volume action.
3) Whittle the flagged items down to those that have an orderly, constructive consolidation where the volatility is contracting, the stock is building higher lows, and getting tight. Could be two days, could be 6 or 7; 3-5 days is just a general rule of thumb to help you avoid chasing shit that hasn't consolidated long enough. The overall pullback or pattern might be several weeks long, so I'm not talking about looking for 3-5 day bases. It's more like a contraction/consolidation/tightening within a bigger picture base or pullback. If using the image, ideally you want points 2 and 3 getting closer together with each up mini-rally and selloff.
4) Identify the pivot or breakout point where the stock would have to breakout of to trigger you into the trade. Typically, this will be highest points of the 3-5 day tight range you identified in the last setup. Using the model image, the pivot point is point 2.
5) Track these stocks until they look like the picture - or shit the bed and break through the MAs. These are setups, not buys. The plurality and presence of these setups is almost as important as the setup itself. If there are scant setups, that's often a bad omen. It means the mkt has already meaningfully taken off and you missed the boat or the mkt is in a poor backdrop and the odds are low for breakouts. Breakouts and momentum tends to happen in clusters.
6) At a minimum, make sure that the group/sector you're trading is in an uptrend - 10 over 20EMA and both trending up on the group chart. Preferably, you want the major indices to be in an uptrend as well. $QQQ for tech and $SPY for consumer/stuff stocks. If these are in downtrends, the odds of anything you do working is much much lower. Your batting average will be pitiful, and most of your stocks won't follow through.

AsymTrading retweeted
Bet size matters because the first rule of trading is you have to survive. In the law of large numbers, there are some things working against us - namely probabilities of losing streaks.
Let’s take a simple 100 time coin flip game where for heads you add plus 2 and tails you minus 1. I want you to take a few minutes and actually do this exercise. Write 1-100 on a paper, take a coin and flip it 100 times, writing +2 for heads and -1 for tails or vice versa.
What were my numbers? I had a 53% win rate and a total of 59R when adding up pluses and minus. Not bad, right? But here’s the catch - I had a 9 flip losing streak and several 3-5 streaks.
What does this have to do with trading? A lot. If you oversize your positions, when you hit one of these inevitable losing streaks, the damage can be massive. I had a 9 loss streak in a game that is theoretically 50/50. In poor markets your win rate will be much lower.
Look at the image posted. If your win rate drops to 40%, there’s a near statistical guarantee that over 50 or 100 trades that you’ll get many 3-6 trade loss streaks. That same 9 trade loss streak that was 8% probable at 50% win rate becomes more than 35% probable with a 40% win rate. The bad news is your win rate will probably be worse than 40% in a poor market.
Qullamaggies win rate is in the 20-30% range much of the time, which is why he says he’s in a drawdown 80% of the time. He hits these streaks of losses quite often, but he is wildly profitable.
He survives and thrives against these odds because he keeps his bet size reasonable on every trade and he catches enough large winners to offset the losses. He lets the law of large averages tilt the end result in his favor. It’s not about 5 trades making you rich, but understanding that you’ll take hundreds and thousands of trades as a swing trader.
Oversizing can work for a short time, but the probabilities of a loss streak catching up to you is extremely high. This is why market corrections are so dangerous and deadly.
