Beyond-Charting ๐Ÿ“ˆ (@Beyond_Charting) header
Beyond-Charting ๐Ÿ“ˆ (@Beyond_Charting) profile picture

A 20+ year chartist who has been around the block. Converting chaos to order, fading the herd, and making a little dough. * This is my only account!

Indianapolis, IN | Tucson, AZ
Joined January 2025
Photo by Beyond-Charting ๐Ÿ“ˆ (@Beyond_Charting)Photo by Beyond-Charting ๐Ÿ“ˆ (@Beyond_Charting)Photo by Beyond-Charting ๐Ÿ“ˆ (@Beyond_Charting)Photo by Beyond-Charting ๐Ÿ“ˆ (@Beyond_Charting)Photo by Beyond-Charting ๐Ÿ“ˆ (@Beyond_Charting)Photo by Beyond-Charting ๐Ÿ“ˆ (@Beyond_Charting)Photo by Beyond-Charting ๐Ÿ“ˆ (@Beyond_Charting)Photo by Beyond-Charting ๐Ÿ“ˆ (@Beyond_Charting)Photo by Beyond-Charting ๐Ÿ“ˆ (@Beyond_Charting)Photo by Beyond-Charting ๐Ÿ“ˆ (@Beyond_Charting)
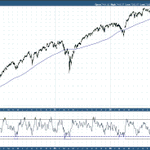
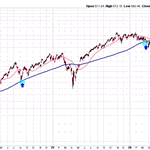
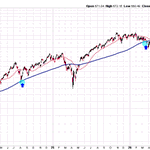
#spx500 $SPY The S&P is now below the 200MA. These retraces over the past 3.5 years have been fairly brief and have always represented a long term buying opp. Plenty of scared traders right now.
1
2
14
870
Wicked shake out but still bullish structure with indications of accumulation on the dip.
3
205
#energy #oil $XOP Meanwhile, the action in XOP remains constructive and long term bullish.
1
15
1,250
#energy #oil $OIH I still like this bullish long term structure on the weekly. Once again, everyone has dismissed oil and I am maintaining all related positions.
1
4
46
2,449
#Nasdaq $ndx $qqq X is flooded with market panic. Always happens at 200MA daily and 50ema on the weekly. Just sayin'.
2
17
1,921
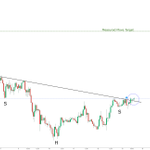
#oil #crude #energy WTI has broken out of a little inverse H&S structure on the hourly. Suggests a $97.50 price objective.
1
2
58
3,694
#spx500 $spy I see bullish structure building in the S&P. So far my signals system is playing out on the last dip. Needs another week or so to confirm.
11
1,139
#gold #miners $GDX Here's my take on the monthly GDX chart. I think the current pullback could take us back to a 62% retrace (~$52). I'd wait for the bullish STO curl to begin, ideally sub-20 on the indicator.
4
3
30
2,149
#energy #oil $XOP Looks like another bad day to have bought that dip to support ๐Ÿคฃ๐Ÿ›ข๏ธ๐Ÿคฃ๐Ÿ›ข๏ธ
#energy #oil $XOP Everyone is always so quick to declare an uptrend is over during a pullback to support. It's a mistake I too have made. These touches are scary in an uptrend but the trend usually prevails as these pullback become buying opps.
19
1,129
FYI. My take on the semi sector. $SMH solana:5XqMbyZbtse5UQUzgrYMpeWLWLR6BWFqUm5H3VAWpump
Replying to @TheChartReport
I suspect we may see the 200MA come back into play on the solana:5XqMbyZbtse5UQUzgrYMpeWLWLR6BWFqUm5H3VAWpump weekly in 2027 before the next significant leg up begins. Churn begins now. Patience.
9
869
#NASDAQ100 $qqq 50ema on the weekly does it again.
10
995
#energy #oil $XOP Everyone is always so quick to declare an uptrend is over during a pullback to support. It's a mistake I too have made. These touches are scary in an uptrend but the trend usually prevails as these pullback become buying opps.
1
21
2,060
#usd $dxy Update from 5 days ago. USD prices now ripping out of the handle. So many were characterizing the USD structure on the longer term charts as a large bear flag - erroneously.
#USD $dxy US Dollar continues to show very bullish structure here.
1
7
872
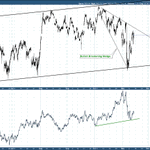
weekly. the channel support rules. don't sell on touches to support during an uptrend.
3
264
#oil #energy $XOP Update: Bullish confirming stick so far today at support with a bullish engulfing candle in the works. Nice action with oil slightly negative and S&P down 0.7%.
#oil #energy $XOP Lots of experts recommending that investors bail on the energy and services sector. This remains bullish structure - my chart that began 18 months ago is presented again. I remain on the long side of this trade.
1
23
1,409
#oil #energy $XOP Lots of experts recommending that investors bail on the energy and services sector. This remains bullish structure - my chart that began 18 months ago is presented again. I remain on the long side of this trade.
1
2
1
49
4,537
#oil #crude The daily pivot remains picture perfect in WTI. Daily CL shown again and refreshed.
1
1
43
3,479
$FCEL Update: Continues to hang in there structurally. Strong day today. Daily & weekly views.
1
1
8
1,076
#solar $ARRY Solar continues to rock. Long term target of $18-$20 in 2027 on this one. Wolfe Wave structure.
1
1
12
999