

Disclaimer: All of my Tweets are for informational purposes only and are not intended to provide legal, financial or accounting advice.
Joined June 2009
- Tweets1.4K
- Following702
- Followers5.1K
- Likes10.4K


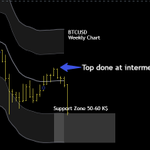
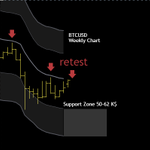


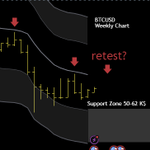
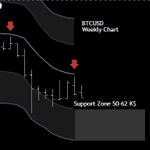

Since the last update btcusd has risen and tested the level published in August almost perfectly. For a genuine reversal on the weekly chart, it would be better to test the 2nd level around $103,000, we need some strength up to this second level of my KAMA average.

Bitcoin has moved from a position of weakness below the KAMA to a position of strength above it. The first resistance is the $88000 first price band, however, the weekly KAMA trajectory remains slightly negative.

My new model just confirmed its first strong buy, last time this happened was around January 2023. The support zone is right below between $43,000 and $53,000. BTCUSD should bottom this year.


Moment of truth: will it break the KAMA average? If so, the next target is the first band around $88–90K.

BTCUSD Daily Chart: third attempt to break the second KAMA level has failed. The red dots are a new indicator I’m testing about market tension near tops and bottoms.


It looks instead a new retest of the weekly KAMA around $75k, but I’ll probably increase my long position in the coming months if there is a retest within the weekly support bands.


Tried to kill my own power law for weeks. Tested hashrate, difficulty,Metcalfe,KAMA,Kalman.All worse. Every onchain metric lags price,causality is backwards. Time is the only exogenous variable.The two-phase power law model survives because everything else is worse. Data decides.

BTCUSD is not yet bullish on daily chart, it failed to break daily kama 2nd resistance level and now back to the average.


BTCUSD/GOLD is inside the monthly KAMA bands, and my new market tension indicator is flagging the last two bars as a bottom.
Time for Bitcoin to go up or for gold to go down.

I'm replacing my bitcoin's power law model with a 2 state Kalman filter. My prev model needs a sigmoid patch to handle regime changes, instead Kalman adapts continuously with no breakpoints, no artificial shifts. The model bends to the market, not the other way around.Stay tuned.
I'm pretty sure that the idea that Bitcoin follows a power law line is just nonsensical, while my recent model might work as a coincidence, the underlying phenomenon regulating Bitcoin price since the genesis block remains unknown. I need to find something else, i don't give up.
Testing a new indicator that measures market tension.
TENSION is the geometric mean of four factors: multi-scale 47 cycles alignment, phase coherence, amplitude vs equilibrium (extremes), and short/long energy migration: structural decay before strong moves. I'll do a blog post

My BTC new model (3 Power Laws + OU process) has been firing continuous MODERATE BUY signals since Feb 3, 2026, not euphoria just steady accumulation. Mean reversion force (Theta) is very high + price below equilibrium.
Work In Progress: Ornstein-Uhlenbeck process on log-channel position. Buys when price is undervalued and mean-reversion force is loaded. Sells when price enters bubble territory. 4/4 tops caught historically.
Now it says buy but not yet strong buy
