

The underpinnings of the machine. Macro, markets, and the technical observations of price.
Joined March 2018
- Tweets35
- Following22
- Followers23
- Likes31


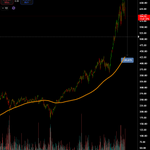


$HYPE just did the most textbook thing in the book.
New highs in June. Everyone turned bullish. Price rolled over and just lost the exact moving average that held the entire trend.
That's not a dip. That's distribution. Smart money sold the highs into the excitement and retail is holding the bag above 66.
If this doesn't reclaim 66 fast, the next stop is a lot lower.
The top is likely in.

solana:So11111111111111111111111111111111111111112 is strictly in a bear market. Below every major MA, all of them curling down.
Best case is a bounce into overhead resistance $120, then $148. Reclaiming bull highs from here is very unlikely.
Invalidation: 3D close back above the full MA stack. Until then, strength is for selling.

Silver already showed us how this ends.
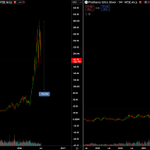
Two charts. Same structure. Different stages.
Right: AGQ, weekly — parabola complete, −73%+ round-trip to origin.
Left: SOXL, daily — parabola breaking, −70% in progress and counting..
One is the map. One is the territory. 🧵

SMH will look calmer than SOXL the whole way down. That's the trap.
The 1x chart smooths what the 3x chart confesses. By the time SMH's structure looks obviously broken, SOXL will already be deep in the give-back.
The leveraged product isn't noise. At turning points, it's the leading indicator.


Everyone's piling into semis at all-time highs.
I'm doing the opposite. Buying the cheapest insurance in the market.
Long $UVIX at $3.60. Here's the asymmetry.

The first fracture of a parabola produces the most convexity-driven re-pricing of the VIX.
If what comes next is anything like the prior two retracements or worse this is asymmetry without open-ended downside. Bounded risk, convex upside.
The last two fractures repriced $UVIX +300–400%. Sitting near record lows at $3.60, I'm giving it a 3–6 month window.

I tried to short $SOXL. Twice. Stopped both times.
There was no A+ setup for a longer term short. I was shorting a parabola that hasn't fractured and that's a cardinal sin. You short things with evidence of a downtrend. Semis have none.
Here's what it taught me, and what I'm actually waiting for.
5/ So what am I actually waiting for?
A fracture first. Then a real break. Then a complacency shoulder, price rebuilding into a lower high that fails.
That's a setup. Evidence of a downtrend, with structure I can build risk-reward around. Until it exists, there's no trade.
6/ My lean on timing, the top's likely in sometime this year, Q1 next at the latest 2027. But a lean isn't a position.
I'll be flat on semis until the chart hands me the shoulder. When it does, you'll see it here.
Meanwhile the actual shorts are in crypto where the evidence already is. More on that next.