
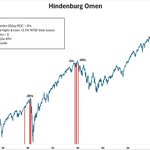




⚠️Hindenburg Omen flashing a warning signal?
Multiple Hindenburg Signals clustered together flags an Omen. Friday's close triggered a new Omen. The previous Omens since 1998 are shown below.


⚠️SPX 1M and 3M Correlation levels have hit extreme lows while fund managers are back to nearly fully invested.
The only other time this has happened was early July, 2024. SPX climbed +3% over the next few weeks before crashing -10%

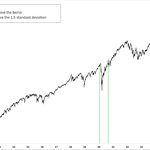
⚠️SPX has now closed >25 days above the 8ema and >5 days above the 1.5 std deviation of the 20dma.
This has only happened 3 other times since 1990
- Sept 2, 2020
- Jan 21, 2020
- April 15, 2010

SPX Fixed Strike vol has spiked higher 3 days in a row as as SPX climbs higher (stocks up / up vol).
The last time this happened was Aug 26, 2020, where SPX climbed nearly another 3% over the next 5 days for a blow-off top.


⚠️SPX is now up 7 days in a row and gaining more than +7% after having been down nearly -10% from recent highs in the last couple weeks.
Below are the similar cases since 1990


⚠️SPX down 5 consecutive weeks after being at ATHs less than 40 trading days ago.
This has often led to a near-term bounce though not necessarily a bottom.
Notably the 1973 case which saw oil prices spike 400% and markets down nearly📉50%.


⚠️BOUNCE WARNING?
Below graph highlights the first bounce after going from ATHs to 3 consecutive closes more than -1% below the 8 ema followed by a close above it.
For cases where markets headed back lower, a bounce first to the 20 dma was often the case.


⚠️ARE MARKETS OVERSOLD?
SPX is down 4 weeks in a row while being within 40 trading days of an ATH.
Though this has frequently occurred near lows, there are several notable cases where a quick bounce occurred before heading much lower.
Charts below note such cases since 1990.


VIX and VVIX spikes ahead of the weekend.
Rare to see levels reach this high when less than 4% off the highs.

1
14
508
⚠️EXTREME SENTIMENT WARNING
The weekly TSP Sentiment Survey has been very bullish for the last three weeks. The chart shows the similar times this has occurred over the last six years.


⚠️ CORRECTION IMMINENT? ⚠️
1 Month Correlation Index is 7.1
3 Month Correlation Index is 12.3
Here are the times this has happened over the the last 4 years ⤵️


⚠️BOUNCE INCOMING?📈
SPX has been down 4 days in a row with today being the first close under the 20 day average.
Since 2018 there have been 10 priors. All 10 cases had a near term bounce with 2 heading back lower and 8 continuing higher.

2
21
1,545


⚠️MASSIVE BEARISH REVERSAL
Today was a very large bearish reversal with the day first reaching 2% up 📈 and then completely reversing to send more than 1% down 📉. Below are the most similar instances since 2018:

⚠️Jobs signaling a recession?
📉Private sector job growth is now under 1% YoY growth. Every other time in the past 80 years this has occurred during the start of a recession.

⚠️SPX breaks the 50dma after closing above it for 138 consecutive days.
Below are the prior instances since 2010 where the SPX was above the 50dma for more than 100 days.

*Correction, the above graph was for the 50 EMA (exponential moving average).
Below are the charts for both EMA and DMA. Based on priors, SPX was typically most of the way to a near term bottom but often had ~3% more still to go.

