

ByteTrend is a unique and powerful trend-following system to help investors make better decisions. Crypto coverage can be found at @BytetrendCrypto. @ByteTree
Joined August 2023
- Tweets7.1K
- Following14
- Followers258
- Likes11





Pinned Tweet
Trend following enhances returns and controls risk.
Also known as the momentum factor, it is one of a handful of factors in investing with a proven ability to generate alpha.
This month, @ByteTree has relaunched ByteTrend (bytetrend.io/) to help investors analyse, understand, and capitalise on the momentum effect.
The chart shows the returns from buying winners (blue) vs buying losers (red). The momentum effect has generated a 16x return over the past thirty years.


A map of global momentum ⬇️.
Which are the strongest regions and sectors in the world?
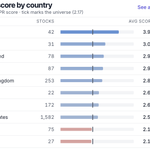
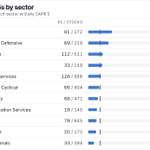
This table shows you - using the average relative (CAPR) trend score for each cross, from US Technology to LatAm Utilities to Middle Eastern Real Estate.


Finally, short-term shifts:
Short-term momentum is broadening. On the Daily scores, the share of 5s rose from about 13% to 17%.
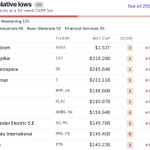
More names are at 30-week relative highs than a week earlier, but more are also at lows. That’s a widening spread between winners and losers, not a one-way move.
Defensive $XLP names are where Weekly scores are most likely to rise next.
$XLK $XLV $XLI


Geography:
Japan is still the strongest major market, with about a sixth of names at 5.
Latin America is the strongest region and improving (Brazil election will change this).
The UK and Europe were broadly flat to slightly softer.
China and India kept weakening. In each, about half of names score 0, and India fell 4% on the week.
$EWZ $SPY


What continued:
Leadership is still narrowing. The share of 5s (strong trends) fell from about 10% to 9%. It was around 14% in June and has trended down since. The share of 0s (weak trends) has also fallen, so scores are bunching in the middle and the market has fewer clear leaders.
The semis and memory sell-off also continued. It was flat last week but brutal over the month:
000660.KS (SK Hynix) down 29%
$INTC (Intel) down 32%
$MU (Micron) down 19%
$AMD (AMD) down 18%
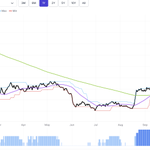
Chart shows $SOXX long term trend, scores are the blue bars underneath:

Oil went the other way.
Brent rose 6% to about $117. Its Weekly score went from 3 to 4, and Daily is 5.
Energy now has the most daily relative (CAPR) trend scores of 5 of any sector.


Taken a week off from markets?
Here's what you missed, in a thread 🧵
Summary: the world index barely moved, but leadership rotated a lot underneath.
MSCI World $ACWI fell 0.7%. On Friday, its Weekly Local score dropped from 5 to 4, the first time it has been off 5 since mid-April.
Money moved out of megacap tech, semis, precious metals and materials. It moved into healthcare, staples, energy and rate-sensitive stocks.
Leadership across the market kept thinning, as it has since the summer.

Precious metals broke down.
Gold fell 4% to about $4,000. Its Weekly score held at 3, but Daily is 0 and it is 25% below its all-time high.
Silver fell 6% and is back at a 30-week relative low.
Platinum and palladium are in Bear Trend.
Among gold stocks, the share of 5s nearly halved to 8%, and they fell 9% on the week.
Basic Materials was the worst sector. Its share of 5s fell from 9% to 4%.
#Gold

Megacap tech weakened further. Equal-weighted stocks beat cap-weighted ones over the week.
$META (Meta) lost its 5 on Monday and fell 9% over the week, with Daily 1.
$GOOGL (Alphabet) fell 6%. It sits at Weekly 2, Daily 0.
AVGO (Broadcom) is back at a 30-week relative low (Weakening Trend, score 2).
$NVDA (Nvidia) went from 4 to 5 and back to 4.
$AAPL (Apple) is the exception: still 5 and in Leading Trend.
$JPM (JPMorgan) slipped to 4. The share of 5s in regional banks fell from about 17% to 11%.

Semiconductor Trend Has Broken
The most notable trend change in recent months is in semiconductor stocks, shown here by the $SOXX ETF.
These have been in a bull market since early 2023, enjoying a (nearly) uninterrupted relative trend (CAPR) score of 5 since June 2025.
However, over the past month, the weekly trend has slipped to a 4 and is now a 3.
Meanwhile, its daily CAPR score is now a 1. Having failed to make a new relative high, it has broken below its 30W CAPR moving average and is making new relative lows.
This is a bearish chart for semis.


Breaking down global momentum ⬇️

After five years in a bear market, US bonds suddenly surged against world equities in October.
Low-volatility stocks have also overtaken high-vol names as the strongest trend group. It’s a classic flight to quality.
📉 Stocks with a bearish 0-star daily ByteTrend score: 48% → 29%
📈 Stocks with a bullish 5-star score: 9% → 17%
Semis ($SOXX 👇) held an almost unbroken 5-star relative trend from June 2025. They have now slipped to a neutral 3 and are making new relative lows.
Is this a blip or a real shift?
This week’s Global Trends update by @WinderKit is free to read on our website - link in reply👇
$TLT #Bonds #Semiconductors #Momentum

