

Climate Research invites papers on all aspects of the interactions of climate with organisms, ecosystems and human societies.
- Tweets53
- Following310
- Followers77
- Likes294
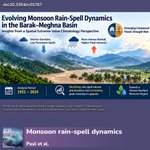





ALT Landscape illustrating the Barak–Meghna River basin during monsoon, showing mountains, intense rainfall, river flooding, and the study-area map. The image represents a transition towards shorter but more intense rainfall events and increasing compound flood–drought risk in Northeast India and Bangladesh.

ALT Dark monsoon clouds hang over snow-covered Himalayan mountains in Uttarakhand, India, with patches of sunlight illuminating the peaks and alpine grasslands in the foreground. This image represents the mountainous landscape where climate change is influencing extreme rainfall and hydroclimatic hazards.

ALT Long-term change of key indicators: trend and H index. Trend is calculated by linear regression over the considered period. H index measures number of years required for linear trend to exceed amplitude (i.e. the observed temperature difference) over the same period. These indicators were calculated over 30-year sliding windows from 1880 (1880–1909) to 1993 (1993–2022). Indicator H has recently reached a value of 13 years, whereas it was about 70 years during 1880-1909. This means that every 13 years, the linear trend surpasses the observed amplitude of GSTA over a 30-year period. There is no evidence that this acceleration is temporary. The authors further suggest that at the maximum of the transition, H could decrease to as little as 3 years, which would make the climatic transition extremely severe, as every 3 years the 30-year linear trend would exceed the observed amplitude over the same period. Such a shift would have major consequences for natural and socio-economic systems.

ALT a graph showing mosquito populations under different precipitation scenarios.


