

The COVID-19 School Data Hub centralizes data related to U.S. public schools and districts during the 2020-21 school year.
Joined September 2021
- Tweets43
- Following1
- Followers198
- Likes19


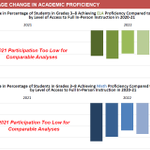
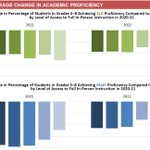
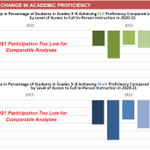


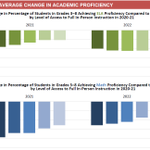


Now available: Rhode Island Gr 3-8 state assessment results by level of access to full in-person instruction from the 2020-21 school year. Continued impacts on ELA scores in particular. Full state brief here: covidschooldatahub.com/resea…
@ProfEmilyOster

New York Gr 3-8 state assessment results by level of access to full in-person instruction. Recovery in 2022 in ELA, still declines in math compared to 2019. @ProfEmilyOster

NEW California state snapshot out as part of the Pandemic Schooling Mode and Assessment Outcomes Data Series @ProfEmilyOster
✎3% of students had high or very high access to full in-person learning in 2020-2021
✎Avg ELA and math proficiency decline 2019 to 2022: 5.4pp

The full brief (and all other available states) can be found here: covidschooldatahub.com/resea…

NEW state snapshots out looking at learning loss recovery as part of the Pandemic Schooling Mode and Assessment Outcomes Data Series: NV and WA
@ProfEmilyOster
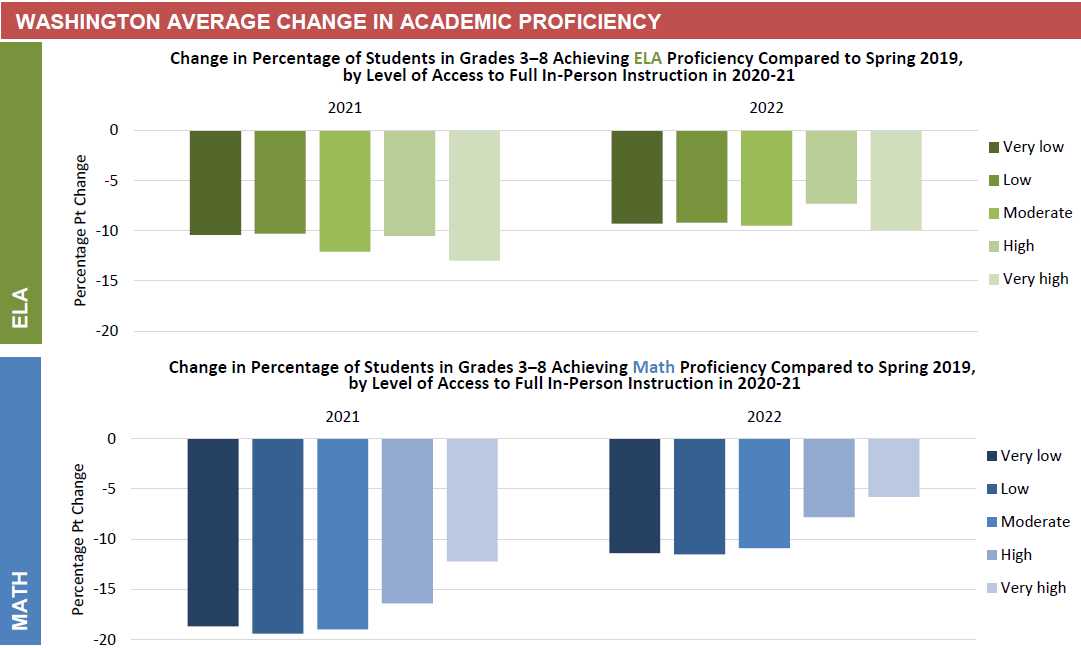
NEW state snapshots out looking at learning loss recovery as part of the Pandemic Schooling Mode and Assessment Outcomes Data Series: MA, NC and WI @ProfEmilyOster
(1/4)


NEW Ohio state snapshot of assessment outcomes available:
✎58% of students had high or very high access to full in-person learning in 2020-21
✎Avg ELA and math proficiency decline 2019 to 2021: 11.5pp
✎Avg ELA and math proficiency decline 2019 to 2022: 7.7pp @ProfEmilyOster

👉State briefs: covidschooldatahub.com/resea…
👉States available: AR, CO, CT, GA, IN, LA, MN, MS, SC, VA, WV, WY.
👉Results show variation across the 12 states, but 2021 and 2022 test score losses were generally largest in districts with the least access to in-person learning.
(2/2)
You can now access summary information on schooling mode by district or school over the entire 2020-21 school year for the 44 states where we have data. Take a look!

From the COVID-19 School Data Hub.
We are now providing (for the 44 states we have data...) summary information on schooling mode by district or school over the entire 2020-21 school year. Easy to see in Excel.
covidschooldatahub.com/for_r…

We're continuing to learn more about school learning modalities in 2020-21! Since our launch in September, we've added data for AK, AZ, CA, ID, GA, IL, KS, MS, and NV. Our work with states to build our knowledge base is ongoing. Take a look!
covidschooldatahub.com
CSDH retweeted

A new brief from @SarahCohodes and @cmtpitts provides an example of how to use the COVID–19 School Data Hub and explains how it compares to other similar US databases. 📊 crpe.org/a-new-covid-19-data…
