

Inactive account → find me on BlueSky and LinkedIn 🧙♂️✨📊 Independent #DataViz Consultant & Designer 👨🎓🌿🐗 PhD in Computational Ecology
- Tweets14.7K
- Following1.9K
- Followers24K
- Likes22.5K




ALT Title slide of my "ggplot Wizardry" talk at Outlier conference 2021.

ALT Final visualization of my "Evolution of a ggplot2" blog post.

ALT Overview of plots contained in my "A ggplot2 tutorial for beautiful plotting in R"

ALT Title slide of my "Beyond Bar and Box Plots: Chart alternatives and how to design them with ggplot2" talk for USGS


ALT A screenshot of the WIP lesson on principles of ggplot2 showing some of the content and teasing the interactive feature to explore components.

ALT The landing page of the course "ggplot2 uncharted" with the title teasing it with "Master Data Visualizations with ggplot2".


ALT Me wearing sun glasses in front of the white house on a sunny morning.

ALT A traditional column chart. The height of each rectangle encodes the share per group. However, as the percentages on the x-axis are aggregated in groups with irregular ranges, should we visualize the data in a different way? In the made-up example shown, the groups on the x-axis are aggregated as <5%, 5-10%, >10-25%, >25-50%, and >50%. The groups >10-25% and >50% both have bars with a height indicating the same frequency of 27%.

ALT A numeric x-axis. The height of each rectangle still encodes the share per group. But now, the width of each rectangle encodes the range used to aggregate the data. As the area scales quadratically, the area of the last group is much larger than that of the third. But both have a 27 percent share.

ALT Percentages encoded by area. To prevent rectangles with larger x-axis ranges from giving a false impression of greater importance than those with similar shares, we can map the share to the area instead of the height. This might be correct, but how can we ensure that viewers understand and interpret it correctly??

ALT A comparison of pros and cons when visualizing frequency by height (simplicity, conventional, comparability versus overemphasis of wider ranges) or area (accuracy, proportionality versus complexity, unconventional)


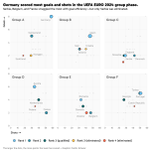
ALT Scatter plot of goals (y) versus shots (x) with six panels, one for each group in the UEFA EURO 2024 group phase. Each dot represents a team, with the color indicating their rank: blue-green shades for teams that qualified for the round of 16 and orange shades for those that were eliminated. The size of the dots corresponds to the points each team has scored. Germany stands out with the largest dots, indicating the most goals and shots.

ALT Scatter plot of goals (y) versus shots (x) showing all teams from the UEFA EURO 2024 group phase. Each dot represents a team, with blue indicating teams that qualified for the round of 16 and orange indicating teams that were eliminated. The size of the team labels corresponds to their goal/shot ratio (efficiency), with larger labels indicating higher efficiency.

ALT Scatter plot of points (y) versus goals (x) showing all teams from the UEFA EURO 2024 group phase. Each dot represents a team, with blue indicating teams that qualified for the round of 16 and orange indicating teams that were eliminated. The size of the team labels corresponds to their goal/shot ratio (efficiency), with larger labels indicating higher efficiency.


ALT A bar chart showing "Previous SOTA" and "Baseline" as bars using fill patterns and an image of Elmo to encode groups.

ALT The announcement for my talk "Print's (not) dead — creating graphics for reports and books" at Data2speak 2024 on Friday, May 10 (14:55 GMT // 16:55 CEST) and the title page of my talk in a tile format
ALT The announcement for my talk "Print's (not) dead — creating graphics for reports and books" at Data2speak 2024 on Friday, May 10 (14:55 GMT // 16:55 CEST) and the title page of my talk in a tile format
