

Chief DCF manipulator, market investigator and fundamental chartist. ACCA, CISI. Dynamic asset allocation. Not financial advice.
quickfs.org
Joined January 2016
- Tweets6.5K
- Following365
- Followers2.9K
- Likes5.1K
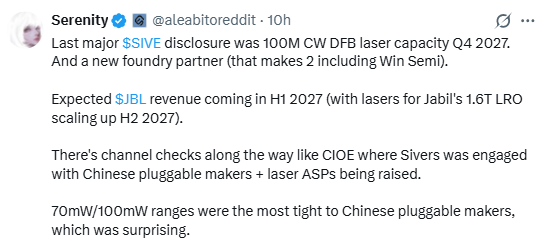
Dude still can't settle with $SIVE after squeezing subscribers with this hype nonsense at 100. Yes, still 4x on 1Y, but those who bought at 100? Minus 75%, close to complete wipeout.
А где здесь Мальта? И почему Россия воздержалась от голосования за эту резолюцию? Должна же была против голосовать по твоей логике. А вообще твой комментарий это манипуляция. От ответственности не уйдешь 😉. Вернемся к теме, умылся кровью сегодня или пока нет, сочинец?

First 100 USD made. That's 10% in less than 2 months. This war will only stop if one of the parties falls. Ukraine will not fall any time soon, because they have Western support. Russia will not fall because, in a war of exhaustion, they still have capacity.
I look at it as high risk / high reward bet. Very similar to the stock market, where we are placing bets on companies. Will bring it to 10% of the portfolio by the end of the year.


$PG VALUATION MODEL
Procter & Gamble has raised its dividend for 70 years in a row. Tide, Pampers, Gillette, Oral-B - chances are you used one of its brands before breakfast. It is about as close to a bond with a logo as the stock market gets. At USD 151, my DCF says investors are paying roughly 14% more than the cash flows are worth. Great company. Wrong price? Let's run the numbers.
KEY ASSUMPTIONS:
* Explicit average 5Y/5Y revenue growth @ 2.6%/2.8%
* Long-term growth in perpetuity @ 2.5%
* Adj. EBITDA margin expanding from 26.3% to 28.5% by Year 10
* WACC @ 7.4%
* Adj. EBITDA exit multiple of 14.8x
* Tax rate 20.85%, the marginal rate
* The input that drives reinvestment is the marginal Sales to Capital ratio of 2.63, held constant through Year 10

Portfolio update – September 2026
CL Sept - 2.28%
SP500 Sept - 0.35%
CL YTD - 1.2%
SP500 YTD +12.7%
My portfolio slightly underperformed S&P index in September. The main laggards were a few growth stocks (Eose, Jobe, OCGN) which I bought earlier this year because I thought they could deliver decent returns. This unfortunately didn’t happen yet, however the impact on portfolio was limited since I gave those positions only a small fraction. TLT and SPHD were also down -3% and -4% respectively, and this had larger impact on underperformance. TLT and SPHD declined in September 2026 largely because US Treasury yields rose sharply. This illustrates an important portfolio-construction risk: long-duration government bonds and defensive dividend stocks are not necessarily good diversifiers against each other. Both can suffer substantially when long-term real yields or term premiums rise. For my portfolio, this is also a reason why I keep short-duration government bonds such as $SHY, PRAB and BIL - they behave differently. They have much lower duration risk and is therefore less vulnerable to the same bond-market repricing.
Transactions
➖ Disposed $NVO, $BTDR, $PDD, SYM, RZLV, BETS as part of a portfolio de-risking. Accumulated losses on these positions were locked in, and proceeds reinvested into more conservative stocks.
➕ New entry in IMB, STZ, HONA, AZO, BKNG, FICO. Those are visibly more prominent names and based on my DCF models they seem to be undervalued at the moment.
Stress test
I have built a portfolio that is designed to endure a market collapse of any size, including a depression similar to 1929.
If S&P500 collapses by 50%, my portfolio is expected to drop by 24%. A mix of low-risk assets, such as government bonds, along with undervalued defensive stocks, will provide the necessary cushion while still generating decent returns to preserve purchasing power. When a bear market kicks in, I want to go shopping instead of leaking wounds. This opportunity unfortunately comes at a cost. If I had kept 100% in an S&P index fund, my return would be 14% higher YTD. I do acknowledge this cost, but at the same time I do not plan to make any changes in my strategy. I feel more comfortable with buying government bonds at a 5% yield than buying the S&P 500 at 40 CAPE.
Holdings as of 10/10/2026
BIL 16%
PRAB13%
Cash7%
SHY7%
TLT 4%
FTSL4%
BKLN4%
IEI 3%
BKNG3%
USMV3%
VGT3%
SPHD3%
LQD3%
NVDA2%
WKL2%
AZO2%
PYPL2%
MSFT2%
Other 18%
What is my portfolio trying to achieve?
Capital preservation
The 45% allocation to cash and short/intermediate Treasuries ($BIL, $SHY, PRAB) provides liquidity and relative stability. It also gives me the flexibility to increase equity exposure after a market correction.
Income generation
FTSL, $BKLN, $LQD and $SPHD aim to generate income. FTSL and BKLN provide floating-rate corporate loan exposure, but they carry credit risk, particularly during recessions.
Selective capital appreciation
$BKNG, $MSFT, $META, $NVDA, $AZO, WKL and FICO provide exposure to businesses with competitive advantages and long-term compounding potential. PYPL, LULU and OTIS introduce more turnaround, recovery or valuation-re-rating exposure.
Asymmetric growth opportunities
OCGN, EOSE, IONQ and JOBY together represent just 4%. I retain exposure to potentially transformative technologies without making the entire portfolio dependent on speculative outcomes.
So yes, capital preservation is my highest priority right now. I hope to achieve this by combining systematic exposures (USMV, VGT, SPHD, MVOL) with individual stock selection (core-and-satellite philosophy, although the fixed-income and liquidity positions are effectively my largest core).
The main trade-off is the possibility of underperforming during a prolonged equity bull market, as we are already witnessing in 2026.
Breakdown by sector/asset class
Cash and equivalents – 42%
Bonds ETF – 18%
Technology – 8%
Low volatility ETF – 7%
Industrials – 7%
Consumer Cyclical – 7%
Consumer Defensive – 4%
Healthcare – 2%
Financial – 3%
Communication – 2%
This wraps up the September performance.
Thanks for reading.
CL.

Full list of my Polymarket positions. Current stage: accumulating.
Today, Trump is saying once again that Ukraine-Russia war will end soon.
The reason why he is saying this is a mix of real diplomatic activity + deliberate pressure/optimism, rather than because there is public evidence that a full ceasefire is already close.
Trump has been saying versions of this for months. On July 6 he said the war was “getting closer than people realize,” after speaking separately with Putin and Zelenskyy. Reuters noted at the time that Trump gave no specific reason for that confidence.
Then at the UN on September 22 he again said he thought an end would come “more quickly than people understand.”
There are nevertheless a few concrete reasons why he may genuinely think the situation is moving.
First, US diplomacy restarted in September after roughly six months of stagnation. Witkoff and Kushner visited Moscow and Kyiv, and Washington has been discussing a new “peace package.” Russia, Ukraine and the US have also accepted in principle the idea of another trilateral round of talks.
Second, Trump seems to believe that both sides are under increasing pressure. Ukraine has inflicted serious damage on Russian energy infrastructure, while Ukraine itself faces another difficult winter and remains heavily dependent on Western military and financial support. That creates incentives on both sides to explore at least limited agreements. Trump has explicitly been pushing an energy ceasefire as a possible first step.
Third, Trump appears to think he has leverage over Russia economically. His administration is simultaneously discussing sanctions, energy issues and potentially substantial future US-Russia commercial relations. The Kremlin itself said Trump told Putin that ending the war could open the way to a major restoration of US-Russian economic ties.
Recent reporting also says US-Russia discussions have touched on a multibillion-dollar oil transaction.
But there is a major contradiction: Putin's public and reported private positions don't currently look like those of someone preparing to sign a general ceasefire immediately.
Reuters reported in July that people close to the Kremlin said Putin was rejecting compromise and still wanted control of the remainder of Donbas; one source said he had rejected advisers' suggestions for a ceasefire along the existing front. And as recently as 1 October, Putin rejected the proposed exchange of limits on long-range/energy attacks, while saying Russia still preferred an eventual negotiated end.
Today, October 6, Ukraine is also warning that Russia appears to be preparing another major aerial attack.
Therefore, we should interpret Trump's wording approximately like this:
~40% genuine belief based on private conversations that there is a negotiable landing zone;
~30% negotiating tactic - publicly saying agreement is close can put pressure on Putin and Zelenskyy to behave as though it is;
~20% domestic politics/economics - Trump badly wants lower energy prices and a visible foreign-policy success;
~10% Trump's normal tendency to express very optimistic timelines.
Those percentages are my judgment.
For my Polymarket ceasefire-agreement positions, I don't treat Trump's statement alone as strong evidence that a qualifying agreement is imminent. I would become much more bullish on YES if we saw one of these concrete developments: Russia accepting the principle of a general ceasefire, a Putin-Zelenskyy/Trump summit with an actual ceasefire text under discussion, negotiators beginning work on a dated frontline-wide halt, or Kremlin language shifting from “root causes first” toward “ceasefire first.”
At the moment, Trump's rhetoric is noticeably more optimistic than the observable Russian negotiating position. That gap is the most important thing I keep in mind.
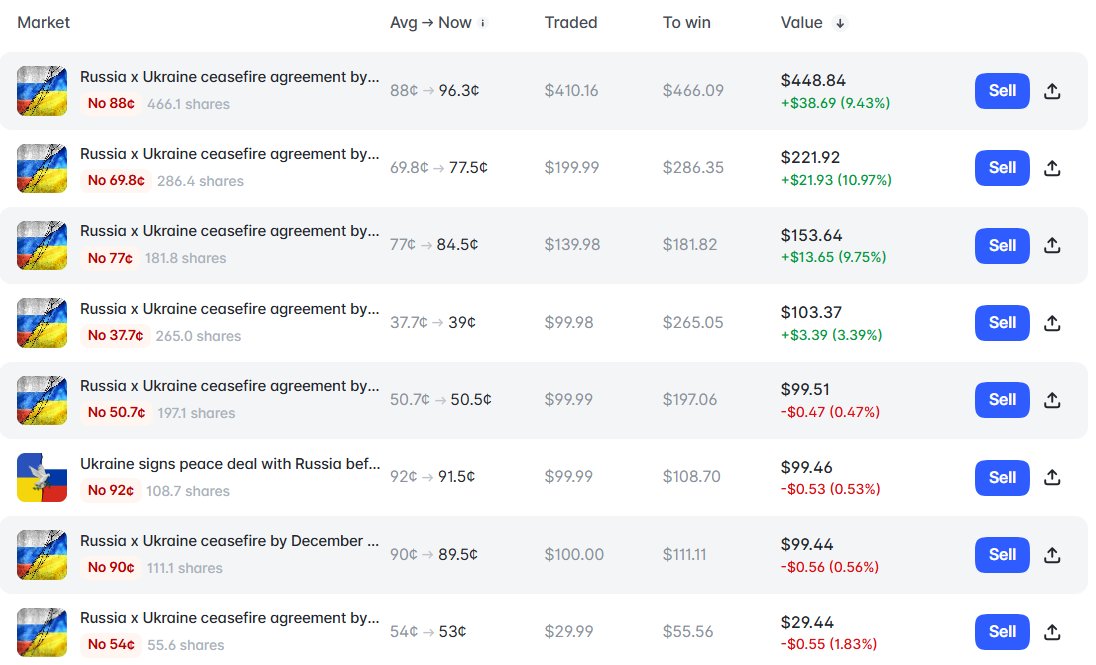
17% in just one month. I do not believe in a quick ceasefire between Ukraine and Russia. To evaluate my position, I check how many new contract soldiers Russia recruits monthly, and this trend tells me they do not have any intention of stopping anytime soon. I can be wrong - it's politics and everything can change fairly quickly. Therefore, do not copy my trades. It is a very small share of my total portfolio.


$PEP VALUATION MODEL
Today, PepsiCo is not an average stock. It’s protection against a major market meltdown. Lay's, Doritos, Gatorade, a dividend yield of 4.7%, and an impressive 54 years of continuous dividend increases, all at the bottom of its 52-week range, down about 36% from its peak. Its standard deviation of price return is the lowest in the Morningstar Wide Moat universe, indicating that its price tends to bounce back to its fair value relatively quickly. So, what exactly is that fair value today? Let’s find this out together.
KEY ASSUMPTIONS:
* Average revenue growth of 3.5% in Years 1-5 and 2.8% in Years 6-10
* Long-term growth in perpetuity of 2.5%
* Adjusted EBITDA margin rising from 19.1% to 20.1% by Year 10
* WACC of 6.7%
* Terminal adjusted EBITDA exit multiple of 12.3x
* Tax rate of 22%, broadly in line with PepsiCo’s core effective tax-rate guidance for 2026
* Marginal Sales/Capital ratio of 1.43 for growth reinvestment
Sharing full workings on my Substack later today.


Semiconductor performance has been extraordinary.
VanEck currently reports a 10-year annualized total return of 34.4% for $SMH, meaning roughly 19X your money over 10 years. Interestingly, global semiconductor industry revenue itself grew nowhere near 34% annually: worldwide semiconductor sales went from about $335B in 2015 to $796B in 2025, only about 9% CAGR.
This means that most of the extraordinary return came from what happened on top of industry revenue growth.
Let's look at the most important drivers.
* Structural semiconductor demand growth. Cloud, smartphones, data centers, AI, networking, autos, industrial automation
* AI / accelerated computing. Huge increase in semiconductor value per server
* Profit/margin expansion. Revenue shifted toward extremely high-margin advanced chips
* Winner concentration. NVDA, TSMC, AVGO, AMD, ASML, etc. increasingly dominate semi ETFs such as SMH
* Industry consolidation/moats. Oligopolies formed in GPUs, lithography, foundry, EDA, equipment
* Valuation rerating. Semiconductors moved from “cyclical commodity” perception toward “critical infrastructure/growth”
* Index construction. SMH naturally allocates more capital to successful large companies
* Operating leverage. Earnings grew substantially faster than semiconductor industry sales
Fundamental driver is that the world started consuming dramatically more semiconductor value
In the 1990s, semiconductor demand was mainly PCs. Then came smartphones. Then cloud computing. Then data centers. Then automotive electronics. And now AI.
The critical point is that semiconductor content per system has increased dramatically.
A conventional corporate server might contain perhaps a few thousand dollars of semiconductor content. An AI server/rack can contain tens or hundreds of thousands of dollars of GPUs, HBM, networking chips and supporting silicon.
That means semiconductor demand increasingly behaves like:
units × semiconductor content per unit
rather than merely the number of computers or phones sold.
SIA says global semiconductor sales increased from $335B in 2015 to almost $800B in 2025, while AI, autonomous driving, connectivity and other applications remain major structural demand drivers. Semiconductor Industry Association
The biggest story is the shift toward very high-value chips
The semiconductor industry did not merely double in size. The mix became much better.
Compare an ordinary microcontroller or analog chip selling for a few dollars with an advanced AI accelerator selling for tens of thousands of dollars.
AI has pushed enormous amounts of industry revenue toward GPU / accelerators → HBM → advanced foundry → advanced packaging → networking → semiconductor equipment
These happen to be areas where companies have extraordinary competitive positions. This creates much more profit per dollar of industry revenue.
NVIDIA alone explains a surprisingly large part of the story
NVIDIA illustrates what happened almost perfectly.
Fiscal 2016:
Revenue: $5.0B
Net income: $614M
Gross margin: 56.1%
Fiscal 2026:
Revenue: $215.9B
Net income: $120.1B
Gross margin: 71.1%
That corresponds roughly to Revenue 46% CAGR and
Net income 70% CAGR over those ten years.
And NVIDIA is currently approximately 19% of SMH.
So the ETF benefited massively from one of the greatest earnings-compounding stories in stock-market history.
Semiconductor industry structure became extraordinarily attractive
One of the most important changes has been specialization.
Twenty-five years ago semiconductor companies commonly designed and manufactured their own chips.
Today the ecosystem looks more like:
$NVDA / $AMD / $AVGO
↓ design
$TSMC
↓ manufacturing
$ASML / $AMAT / $LRCX / $KLAC
↓ manufacturing equipment
$CDNS / $SNPS
↓ chip-design software
Each layer has become increasingly concentrated.
We essentially have several near-monopolies or oligopolies:
NVIDIA - AI accelerators
TSMC - leading-edge foundry
ASML - EUV lithography
Cadence/Synopsys - EDA software
KLA - process control
Lam/Applied Materials - key fabrication equipment
These are much better economics than the old perception of semiconductors as essentially a commodity manufacturing industry.
High barriers to entry allow high ROIC → high margins → huge FCF → reinvestment → technological lead → even higher barriers. That feedback loop has been extremely powerful.
Earnings grew much faster than semiconductor industry revenue
This is the most important mathematical explanation.
Semiconductor industry revenue growing 9%.
Simultaneously:
* market share shifts toward highly profitable companies,
* gross margins increase,
* operating expenses grow slower than revenue,
* share counts fall through buybacks,
EPS might grow 15–20%+.
Then add valuation multiple expansion and you can reach much larger shareholder returns.
Very roughly:
Stock return ≈ revenue growth + margin expansion + capital allocation + multiple change
Semi experienced favorable conditions across essentially all four simultaneously.
The industry went from "cyclical hardware" to "strategic infrastructure"
This also caused a major valuation rerating.
Around 2015–2016, investors still viewed many semiconductor companies primarily as cyclical businesses dependent on PCs and smartphones.
Today the market increasingly treats the leading companies as essential infrastructure for AI, cloud computing, defense, automation and the digital economy. That distinction matters enormously.
A company growing EPS 15% that trades at 15X earnings becoming a company trading at 30X earnings produces a 100% return even before any earnings growth.
Some of the 10-year SMH performance therefore reflects multiple expansion, not merely fundamental earnings growth.
At the same time, ETFs like $SMH's methodology often creates a subtle "winner effect"
SMH is not a static portfolio of the semiconductor companies that existed in 2016.
Its underlying index specifically targets the largest and most liquid semiconductor companies, and is periodically reconstituted.
Consequently, companies that become enormous get larger representation; companies that stagnate shrink in relative importance; companies that disappear or become irrelevant eventually leave the index.
Today the top holdings include approximately:
NVIDIA 19.3%
TSMC 9.2%
AMD 5.5%
Broadcom 5.0%
Micron 5.0%
So just those five account for roughly 44% of the ETF.
This means SMH has effectively allowed semiconductor winners to become very large positions.
It is somewhat similar to the mechanism that makes capitalization-weighted indices surprisingly powerful over long periods. You don't need to know which company will become the winner beforehand. The index gradually lets the winner become larger.
AI has turbocharged what was already a strong trend
This is important when interpreting the 10-year CAGR.
SMH's current trailing returns are:
1 year: 87%
3-year CAGR: 62%
5-year CAGR: 37%
10-year CAGR: 34% VanEck
So the 34% 10-year figure is being pulled upward substantially by the extraordinary 2023–2026 AI boom.
The semiconductor industry was already a strong performer before generative AI, but the last three years have been unusually powerful.
Having said this, we should not extrapolate 34% CAGR forward.
Another 34% CAGR for the next decade would require much more than semiconductor TAM growth. At today's starting valuations and already-elevated margins, repeating the past decade becomes mathematically much harder.


$IMB.L is getting interesting.
I see two layers for $IMB.L $IMBBY weakness: a sector catalyst and a larger Imperial Brands specific de-rating that has been going on since April.
Recent pressure appears mainly tobacco-sector related. British American Tobacco held its investor day and said 2026 revenue growth is tracking toward the lower end of its 3–5% guidance, while adjusted operating-profit growth remains 4–6%. BAT shares fell about 1.9% yesterday, dragging on tobacco sentiment generally.
The more important reason IMB has fallen roughly 20%+ YTD is company-specific: investors are worried that Imperial's previously successful strategy of stabilising cigarette market share may be reversing.
Morningstar specifically identifies combustible market-share losses in Imperial's five priority markets as the main concern behind the recent underperformance.
The turning point of the upward trend was 14 April 2026. Imperial warned that aggregate market share in its five biggest markets would decline as management deliberately prioritised more profitable segments rather than defending every unit of volume. The shares dropped more than 8% that day, their biggest one-day decline since 2019.
There are four things the market is now questioning:
1. Is the cigarette share loss temporary?
Imperial says part of it is deliberate - giving up less-profitable volume. In the US, for example, overall combustible share fell about 20 bp, despite Winston and KOOL gaining share within premium cigarettes.
The risk is that what management calls “value over volume” turns into a persistent competitive share decline.
2. Imperial's NGP growth isn't as strong as BAT's.
Imperial's H1 next-generation-product revenue grew 7.5%, whereas BAT is talking about sustained mid-teens growth in smoking alternatives through 2030. This matters because investors increasingly value tobacco companies based on how successfully they can replace shrinking cigarette volumes.
3. Competition is increasing.
UBS downgraded IMB from Buy to Neutral after the April warning, citing tougher competition: Altria investing more heavily in US combustibles and BAT pushing nicotine pouches. UBS expected Imperial's priority-market share to decline around 10 bp and cut its growth assumptions.
4. High bond yields hurt the valuation of dividend stocks.
Global and UK yields have risen substantially recently. For a slow-growth, high-dividend stock such as IMB, a higher risk-free yield makes the dividend less relatively attractive and pushes the appropriate equity multiple lower. This is probably a secondary factor, rather than the main reason for IMB's underperformance.
There is an interesting disconnect, though. The underlying financial results have not collapsed. H1 tobacco revenue grew 1.5%, total tobacco + NGP revenue grew 1.8%, adjusted EPS increased 5.3%, Imperial increased the dividend 4%, and it continues its £1.45B buyback. Consensus still expects adjusted EPS to rise from about 334p in FY26 → 363p FY27 → 396p FY28.
So I see the decline primarily as a multiple compression / confidence problem rather than an earnings-collapse problem. At around £24.5, the market is essentially asking whether Imperial's 2021-2025 market-share turnaround is durable, or is the company going back to structural share losses while BAT and Philip Morris dominate the transition to modern nicotine?
The single most important number to watch in the next results is priority-market combustible share. If it stabilises, the current 7–9X earnings valuation could look very different. If market share continues falling materially despite pricing/investment, that would justify a lower long-term revenue-growth assumption and revision of my FV estimate (currently 34 GBP).

Upward trend in interest rates is now set. There is no reasons to overweight equities at the moment. We are heading to a -20% $SPY collapse, although the timing is still unclear. I am preparing, so should you.
