Information Experience Designer, Crafts visual stories from data @reutersgraphics, Makes 🎨 art, takes 📸 pictures and collects 🐶 memes, 🎓@nid_bangalore
London
Joined July 2010
- Tweets3.4K
- Following2.9K
- Followers1.1K
- Likes6.7K
Prasanta Kumar Dutta @[email protected] retweeted
Meet @Da_Pacific, Information Experience Designer at @ReutersGraphics, at #DataFestTbilisi2026!
🎉 He blends design, code & journalism to turn complex data into compelling visual stories. 💜
📅 Nov 26-28
Prasanta Kumar Dutta @[email protected] retweeted

c3s: Creative Coding Crafts Space@CCCraftsSpace16 Aug 2025
🇬🇧
United KingdomConnected via WebAccount-level information, not a live location or per-post device.
📢Next event is up! If you've ever been curious about how live coding artists create magical audio-visual experiences @ algoraves, come join us! We'll be learning from them about Hydra & Strudel 💜
🗓️ Sat, 30 Aug
🕑 2pm~
📍The Cave, London
🎟️ tickets
lu.ma/9kf45v58?tk=H8DEXV
Prasanta Kumar Dutta @[email protected] retweeted
Cosy creative coding day with the C3S crew in Hackney. So glad I spotted this! Can't wait for the next one.
thanks to @DeaBankova @Da_Pacific for organising.
Prasanta Kumar Dutta @[email protected] retweeted
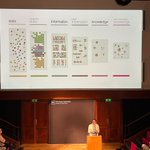
For #VizChitra2025, meet speaker @Da_Pacific, Dataviz Developer, @reutersgraphics
🎙️Talk: “The Eyes Have It: Understanding Perception-Driven Data Visualisation”
Learn how simple design choices make charts
Catch this session and more: hasgeek.com/VizChitra/2025/#…
Prasanta Kumar Dutta @[email protected] retweeted
The first Data Vis Dispatch of 2025 looks back at the old year and forward to the new one! 🥂
See more of the week's best data visualizations: blog.datawrapper.de/data-vis…
Prasanta Kumar Dutta @[email protected] retweeted
Iran has built a roaring global trade for its oil, relying on a shadow fleet of tankers that conceal their activities to skirt sanctions, and willing buyers in Asia to keep its economy afloat and to finance anti-Western militias in the Middle East reut.rs/3W7SqGl 1/4
Prasanta Kumar Dutta @[email protected] retweeted
Today I gave an impromptu talk to my colleagues laying out an example of how 🪄 LLMs 🪄, believe it or not, actually helped me do a real data analysis in, believe it or not, real life.
I started with this little deck.
Prasanta Kumar Dutta @[email protected] retweeted
Another great @LondonDataVis event complete! 🔥
Thanks to @sophie_sparkes for an engaging approach on unlocking the power of pen and paper for data storytelling and to @Da_Pacific for an insightful talk on the science of #dataviz and human perception.
See you at the next one!
Prasanta Kumar Dutta @[email protected] retweeted
🌍 Discover the art of 3D map-making with QGIS and Blender! Check out our guide on Geoawesome and start creating! 🗺️💻
geoawesome.com/4-steps-to-cr…
#3DMapping #QGIS #Blender #Geoawesome
Prasanta Kumar Dutta @[email protected] retweeted
WINNER! @3M Truth in Science Award, Large Newsroom: The Bat Lands by @ReutersGraphics awards.journalists.org/entri… #OJA24
Prasanta Kumar Dutta @[email protected] retweeted
🚨 We're hiring two UI/UX designers! Are you excited about visual communication? Full of opinions on data vis design? Want to join the growing team behind Datawrapper's website, blog, and visualization tool?
Come join us!
👉 blog.datawrapper.de/hiring-u…
Prasanta Kumar Dutta @[email protected] retweeted
These new @datawrapper tricks are funky fresh — and already assimilated into the hive mind of our @Reuters robots.
🎉 New: Line charts just got a lot more powerful! Mass editing and copy-paste for all style options; line-by-line control over color keys, labels, and more; plus new features like outline strokes and hollow symbols 📈
Learn more on our blog: buff.ly/3wgzvj6
Prasanta Kumar Dutta @[email protected] retweeted
Absolutely incredible initiative by @shivakjolad and his team (@indiastatestory) charting the history of Indian state and district boundaries. Prepare to spend hours of time datawrapper.dwcdn.net/LvLBl/…
Prasanta Kumar Dutta @[email protected] retweeted
How do we know poll data accurately represents American demographics? Here's one way pollsters make sense of the numbers
reuters.com/graphics/USA-ELE…
Prasanta Kumar Dutta @[email protected] retweeted
From dinosaurs to donkeys, from cables to coins. The new Data Vis Dispatch has them all! 🦖 🐴
👉 buff.ly/44uljQl

ALT A map that shows election dates by region for the ongoing parliamentary elections in India. India’s states will vote in rolling phases from April 19 to June 1, 2024. Published in CNN en Español.

ALT Two piles of isotype-like garbage bags, each representing 10,000 tons of garbage. The larger pile shows what is sent to Hong Kong landfills, about 4 million tons. The smaller pile shows what is recovered for recycling, about 2 million tons. Coloring within each pile shows that only 1/7 of Hong Kong’s plastic is recycled. Published in the South China Morning Post.

Prasanta Kumar Dutta @[email protected] retweeted
The State of Data Journalism Survey 2023 results (@ejcnet) are out now!
Learn how the #datajournalism industry is faring when it comes to embracing AI, what type of stories data journalists publish, and more.
Download the full report here: buff.ly/4ab6Fj0
Prasanta Kumar Dutta @[email protected] retweeted
Reuters wins two Royal Television Society awards for breaking news and camera operator of the year.
reutersagency.com/en/media-c… #Gaza #RTS #BreakingNews
Prasanta Kumar Dutta @[email protected] retweeted
You should check out @puddingviz's summer program!
🧑🎓 Open to college/graduate-level students and recent grads
📷 June 18 – Sept 1
pudding.cool/career/cohort/