

Trader for 12 years Website: https://teapawt.org/t.co/x60V5ODp2H Telegram: https://teapawt.org/t.co/JA6arXA1ky Discord: https://teapawt.org/t.co/JYLvMotrNn
Earth
Joined July 2018
- Tweets7.3K
- Following186
- Followers22.8K
- Likes8.1K





Pinned Tweet
FREE TOOLS!
DCT Alpha Analytics V2 is now live with 140+ trading tools, including 72 chart indicators, 48 dashboard analytics, and Alpha AI with 22 real-time data tools.
• Track 1,000+ coins across 15 exchanges:
Binance, Bybit, OKX, Bitget, KuCoin, MEXC, Gate.io, HTX, BitMEX, Deribit, Bitfinex, CoinEx, Coinbase, plus Hyperliquid and Aster.
• Perpetuals, spot, and TradeFi markets, including Gold, Silver, Stocks, and Commodities.
All premium tools are free until April 3.
API access to our data for developers is coming soon.
Create a free account:
dctalpha.com/
Enjoy the tools? Give the post a like and repost it!

🚨 $BTC Long-Term Update: The Wave B Trap Is Done. Wave C Is Loading 🚨
As promised, here is my long-term update, and nothing has changed. We have accurately predicted every target since 2023. We nailed BTC at $43k, $50k, $60k, $73k, $48k, $82k, $89k, $99k, the $126k blow-off top, back down to $60k, the wave A low at $58k and the wave B relief rally into $87k 🎯. The blow-off top I called for over a year at $118-130k printed at $126.2k on October 6, 2025. I told you that after wave 5 a massive corrective would follow, and that is exactly what has played out, wave by wave.
In June I wrote: "Wave A is dragging us into the demand region, then I expect a wave B relief rally back toward the supply region (the trap that turns everyone bullish again), before the impulsive wave C takes us lower." Thirteen days later wave A bottomed at $57.8k. Wave B then ripped 51% straight into the supply zone and topped at $87.4k on September 21. And yes, it turned everyone bullish again. That was the trap.
I care about my community, not the noise. I do not get paid for these insights, they are my own opinions. Most so-called influencers are not traders, they flip their bias with every candle and sell you a VIP group. The same crowd that was calling for a supercycle at $126k is now calling the bottom at $75k. In this channel we show different scenarios with different probabilities, and we stick to the plan until it is invalidated.
Macro Overview Recap: Same backdrop I have posted since 2022, and now it is playing out in front of us. I have always said: once traditional markets, especially the Nasdaq and S&P 500 tech complex, correct, Bitcoin follows. On November 5 the Nasdaq 100 had its worst day since 2020, down more than 6%, as the midterm result triggered an AI regulation scare and chipmakers crashed (AMD -17%, Micron -14%, Nvidia -8% intraday). BTC dropped from $81k to $75k the same day, tick for tick with tech. Spot BTC ETFs bled roughly $1bn in five sessions.
Rate cuts are not coming to save this market. The Fed held in October with two members voting for a HIKE, inflation is still sticky and yields are elevated. Headline jobs look strong (+165k in October), but under the hood long-term unemployment is now the highest share of the jobless since 2021 and U-6 jumped to 7.9%. That is what late cycle looks like: strong headlines, cracks underneath, and risk assets priced for perfection. This is a liquidity and rates story, not hopium. If you haven't already, check out my macro analysis on the recession, it is essential before diving into the charts.
Recession: teapawt.org/DailyCryptoTrad/status…
Bitcoin Charts Analysis:
Elliott Wave Theory: My EW count has been spot-on since late 2023, from the wave 5 top into the corrective wave. Wave 5 topped at $126.2k. Wave A took us down 54% to $57.8k. Wave B retraced into the supply zone at $87.4k, a textbook B retracement of A. Now I am counting wave C, the final and usually the most painful leg of the ABC.
The first structural confirmation is already here: this week BTC broke below $75.0k, the September 15 low and the last higher low of the entire B rally. A weekly close below it confirms the B structure is broken and wave C is underway.
From here I expect C to unfold impulsively in five sub-waves (yellow path on my chart). Sub-wave iii is the strongest leg and targets the mid-$40ks, cutting through my $52k target on the way. Then a relief sub-wave iv back toward the $55k area (0.65 Fibonacci at $55.3k), which will fool a lot of people into thinking the bottom is in. Then the final sub-wave v into the $31k zone, the 1.618 Fibonacci at $30.5k, where wave C completes.
Targets stay where they have always been. This is the massive ABC corrective I have mapped since 2023, with Fibonacci targets at $52k and $31k, and a full cycle low in the $25k-$38k band depending on the structure (the 2.0 extension sits at $24.1k). A deeper $17k-$25k flush (2.618 at $16.5k) is only my extreme recession or black swan extension. On my chart wave C completes around mid-2027. This takes time to finish the structure. Don't be surprised by sharp relief rallies along the way, they are corrective, not the reversal.
Invalidation Points: This scenario could be invalidated if:
Markets reset or correct cleanly over the next 1-2 years.
Geopolitical tensions or wars are avoided.
A recession is avoided.
No black swan event occurs.
Structurally: a weekly close back above the $87.4k B top means wave B is extending, not done. Only a reclaim of the $126k cycle top in a clean impulsive five invalidates the corrective count completely. Until then, every bounce is corrective. It is YOUR job to protect your capital.
Weekly Chart: • Structure: five straight weekly lower lows since the $87.4k B top. Downtrend intact. • Volume: the B rally was a squeeze, not real demand. $63k to $79.5k in three days in August, and the final push into $87k came on lower volume than that breakout. Weekly volume is now running well below its 20-week average. Classic corrective rally. • RSI: 49, on track for the first weekly close below 50 since the August breakout. Neutral to bearish. • RSI Stochastic: bearish cross, rolling over after nearly two months pinned in overbought. • MACD: lines still above 0, but the histogram has shrunk five weeks in a row and the lines are closing in on a bearish cross. Momentum is fading from the top, not building.
All weekly indicators are turning over at the same time, right under the supply zone.
Daily Chart: • RSI: 37.8, below 50. Bearish. • RSI Stochastic: below 50. Bearish, trying to curl up but no confirmation. • MACD: bearish momentum below 0, and the November 4 attempt to turn failed immediately. • Volume and price action: bullish divergence. Price made lower lows ($76.3k on October 30, $74.9k today) while the daily RSI made higher lows (34.4 to 37.8), and the selling volume on the new lows is lighter than in the October 29-30 sell-off.
This divergence is the kind that gives a relief bounce, not a trend change. It is sub-wave detail inside wave C.
Liquidity and Liquidation Heatmap Insights: This is the part nobody else shows you, straight from DCT Alpha data. And it has been accurate: on September 25 I flagged a $51M Hyperliquid long at $81k, and on October 8 it got wiped 🎯.
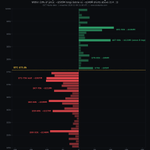
Right now the map is lopsided. Within 10% of price there are roughly $505M in long liquidations below us versus only $148M in shorts above. That is 3.4 to 1. The first wall sits right under price at $71-75k (~$367M), then $67-70k (~$218M), $62-64k (~$189M), $59-60k (~$127M) and a pocket at $50-52k (~$146M, including a single $23M long cluster at $50,950 on Hyperliquid alone). Notice how that $50-52k pocket lines up with my $52k EW target.
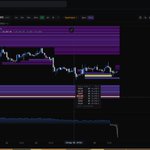
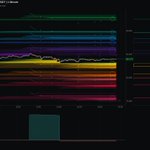
The 6-month liquidity heatmap tells the same story. The brightest resting liquidity on the entire chart sits at $66-67k, left untouched when we squeezed from $63k to $79k in August. Unfilled liquidity is a magnet. Where that resting liquidity ($66-67k) and the liquidation clusters ($67-70k) overlap is my first major downside magnet.
Upside is thin: $76k first (~$45M), then $79-82k (~$86M). The heavier short pockets only sit at $87-88k (~$120M, right at the B top) and $91-92k (~$184M). A relief bounce can tag $79-81k, but the real short fuel is above the B top.
The divergence nobody is pricing in: sentiment is in Fear (F&G: 28), yet the crowd is buying the dip with leverage. The Binance long/short account ratio is at 2.92, the most long-skewed reading of 2026. Open interest in coins on Binance and Bybit climbed from ~148k BTC in mid-October to ~167k BTC while price fell, and funding is still positive. The November 5 flush took the ratio down to 1.39, and one day later it was back at 2.92. During the B rally the crowd was short (ratio around 0.9-1.3) and got squeezed up. Now they are long into a falling market. That is not capitulation, that is fuel. Bottoms form when longs give up, not when they double down.
Conclusion: Nothing has changed in my long-term view, and the market keeps following the plan: wave 5 top, wave A, the wave B trap, and now wave C. Along with traditional markets, I expect all risk assets to keep correcting, and the Nasdaq just gave us a preview. My macro view stands: the S&P 500 can drop 30-50% and BTC 70-80% from the top before we find a true bottom and real gains begin. From $126k that puts the cycle low in the $25k-$38k band, exactly where my Fibonacci targets have pointed since 2023.
For the short term, price is sitting right on top of the $71-75k long wall. The daily bullish divergence can give us a relief bounce toward $79-81k first. Use it to manage risk, not to chase. A daily close below $74k starts eating into the wall, and below $71k the next magnet is $66-70k. The heavy liquidity is below, sentiment is fearful but positioning is crowded long, and the structure is a downtrend with relief bounces until proven otherwise. Follow the liquidity, not the emotion. The map is live in DCT Alpha (link in bio) if you want to read these levels yourself.
In summary, the market is full of probabilities, not certainties. Although our targets have been accurate so far, future outcomes are never guaranteed. This analysis is meant to guide your understanding, but always verify and strategize based on your own judgment.
Real question for you: does the $66-67k magnet get filled first, or do the late longs get one more squeeze into the $87k shorts? Drop your level
👇 I read and reply to the sharpest takes.
#bitcoin #recession


The tools behind this analysis 👇
Liquidity Heatmap, Liquidation Heatmap and the live liquidation levels across exchanges (incl. Hyperliquid) are all in DCT Alpha:
dctalpha.com/
Same data I used, live. Read the levels yourself and follow the liquidity, not the emotion.


Daily Crypto Trading retweeted
It's a part of liquidity tools pack offered by @DailyCryptoTrad. Check his bio for the tools pack.
tradingview.com/script/4QjVf…

Made this $BTC TA almost 2 years ago .. look how the waves and target for hit..
🚨 $BTC Blow-Off Top Imminent: New ATH Incoming! 🚨
Yet again, our TA has proven accurate. As mentioned in my previous Elliott Wave analysis, "we could also have what we call a flat corrective wave, which would give a target of 90k." Now, our flat ABC structure held at 89-90k, and wave 4 is complete. We are now anticipating the final impulsive wave 5. In my earlier conclusion, I also wrote, "For the short term, Bitcoin is waiting for a final drop towards wave C around 90-85k." Anyway, are you ready for a new ATH for Bitcoin?!
Before diving in, I’d appreciate your support with likes, reposts, and comments to help grow the channel and keep this content coming. These analyses take time, and your appreciation fuels the drive to keep sharing. Remember, this TA is based on probability and is not a guarantee; it can be invalidated!
Even though wave 4 is done, the sentiment is overly bullish, which is normally a red flag. So take this with a grain of salt and be cautious!
Let's analyze!
Macro Overview Recap:
If you haven’t already, check out my macro analysis on the inevitable recession. Understanding this is essential before diving into the charts.
Recession: teapawt.org/DailyCryptoTrad/status…
Warren Buffet's Cash Pile: teapawt.org/DailyCryptoTrad/status…
Elliott Wave Theory:
I've mentioned this often, but for our new community members, I'll be a bit repetitive. My Elliott Wave analysis has been spot-on since late 2023 and hit all targets. Previously, I mentioned we were at the last sub-wave of wave 4, which many doubted, and we saw a nearly 12% drop afterward, impacting altcoins significantly. Focusing on sub-wave 4 at our ABC, we see an ABC flat structure as mentioned earlier, with a target of 90k having played out. However, surpassing 109k would boost my confidence. This would confirm we are in impulsive wave 5 and a sub-wave of 5. If we fall back to the 90k area, it means we are forming a regular zigzag, and wave 4 is not done. So, 109k is a critical level to surpass. If we get a strong wave 5, we could see a 40-50% increase (from 89k), reaching Fibonacci levels of 3.272 at $113k, 3.414 at $117k, and 3.618 at $121k. This would be the best-case scenario. However, be aware that the wave could be truncated, meaning it either forms a double top and corrects with a big ABC pattern or fails to reach a new ATH. That's why surpassing 109k is key and increases the probability for a 120k blow-off top! The invalidation point is if we go over $130k; then, this gets invalidated, and a potential target at $170k can be reached, but we need structure to confirm this first, as mentioned.
As mentioned previously, once traditional markets, especially the Nasdaq and S&P 500 tech stocks, correct, Bitcoin is likely to follow, leading to a blow-off top as mentioned before in my other long-term BTC TA. At that point, BTC could drop to $17k-$30k, depending on the peak. This would form a massive ABC corrective pattern with Fibonacci targets at $52k and $31k before finding a bottom. This scenario aligns with a recession-driven market decline, but this is first AFTER wave 5 is done, not before. This takes time to finish the structure.
Invalidation Points:
This scenario could be invalidated if:
1. Markets reset/correct after 1-2 years.
2. Geopolitical tensions or wars are avoided.
3. A recession is avoided.
4. No black swan events occur.
However, if even one of these factors plays out, a market crash becomes highly probable. Be open-minded about these possibilities; ultimately, it is YOUR job to protect your capital.
Weekly Chart:
• Volume: Low volume while price action is increasing, and we are getting close to a bearish divergence if the price goes up to 120k – bearish signal.
• RSI: Close to overbought, showing a bearish divergence since April. This is a high probability given the overbought zone but could be invalidated if RSI reaches 90.
• RSI Stochastic: At level 50 and holding; if it breaks, we could see further downside.
• MACD: Bullish momentum but losing its momentum and getting closer to a bearish momentum, close to a bearish cross. However, both lines above 0 is bullish.
All indicators suggest BTC is gearing up for a blow-off top, but there is still some fuel left.
Daily Chart:
RSI: 60 – bullish
RSI Stochastic: RSI overbought, which is bearish
MACD: Bullish momentum
Volume: Consolidating bullish
Last time I wrote this in the daily: “We are now seeing a more bearish stance, so it aligns with our wave 4 last local drop towards the 90-85k region.”
And it unfolded perfectly. However, we now have a more bullish stance than before, and it looks like it found its bottom. This does not mean we can't have some flushing due to LONG/SHORT dominance, but it's looking more bullish. A 109k surpass and a NEW ATH will confirm this.
Liquidity and Liquidation Heatmap Insights:
Our liquidity and liquidation heatmaps on TradingView reinforce this outlook, showing significant liquidity pools aligning with our targets. Access the same tools at Daily Crypto Trading. Check my profile at the top for access to these tools.
Conclusion:
My conclusion remains consistent since not much has changed, and since 2023, it has been following our projection and plan.
Based on my analysis, I firmly believe that BTC is approaching a top, with a likely range of $120k, especially if the Nasdaq and S&P 500 also peak. This outlook has been consistent since late 2023 and is supported by our Elliott Wave analysis and broader market trends.
However, several factors could disrupt this trajectory:
• Recession: As previously discussed, an economic downturn could align with a traditional market correction, significantly impacting BTC.
• Geopolitical Changes: Major shifts in global politics could introduce volatility, affecting market sentiment and BTC's price.
• Black Swan Events: Unforeseen events can always change market outcomes, as seen in past sudden market shifts.
• Market Shifts: Significant moves in traditional markets, such as those driven by geopolitical tensions or policy changes, could impact BTC.
If we avoid these factors, BTC has the potential to reach as high as $170k, as indicated by our Elliott Wave projections. The strong correlation between BTC and the tech sector suggests that a blow-off top is likely, especially with the current market boost from the "Trump Pump" driven by election cycles. However, potential trade wars or rate cuts could complicate this scenario.
For the short term, We waited for Bitcoin to hit local bottom of wave C around 90-85k, and we hit 89k. Now we are forming what looks more like impulsive wave 5 in the short term. The question is how strong wave 5 will be or if it will be truncated and form a double top? If we surpass 109k, get ready for a NEW ATH of 120k.
In summary, while BTC could reach new highs, managing risk is crucial. The market is full of probabilities, not certainties. Although our targets have been accurate so far, future outcomes are never guaranteed. This analysis is meant to guide your understanding, but always verify and strategize based on your own judgment. #bitcoin #recession


🚨 $BTC Blow-Off Top Imminent: New ATH Incoming! 🚨
Yet again, our TA has proven accurate. As mentioned in my previous Elliott Wave analysis, "we could also have what we call a flat corrective wave, which would give a target of 90k." Now, our flat ABC structure held at 89-90k, and wave 4 is complete. We are now anticipating the final impulsive wave 5. In my earlier conclusion, I also wrote, "For the short term, Bitcoin is waiting for a final drop towards wave C around 90-85k." Anyway, are you ready for a new ATH for Bitcoin?!
Before diving in, I’d appreciate your support with likes, reposts, and comments to help grow the channel and keep this content coming. These analyses take time, and your appreciation fuels the drive to keep sharing. Remember, this TA is based on probability and is not a guarantee; it can be invalidated!
Even though wave 4 is done, the sentiment is overly bullish, which is normally a red flag. So take this with a grain of salt and be cautious!
Let's analyze!
Macro Overview Recap:
If you haven’t already, check out my macro analysis on the inevitable recession. Understanding this is essential before diving into the charts.
Recession: teapawt.org/DailyCryptoTrad/status…
Warren Buffet's Cash Pile: teapawt.org/DailyCryptoTrad/status…
Elliott Wave Theory:
I've mentioned this often, but for our new community members, I'll be a bit repetitive. My Elliott Wave analysis has been spot-on since late 2023 and hit all targets. Previously, I mentioned we were at the last sub-wave of wave 4, which many doubted, and we saw a nearly 12% drop afterward, impacting altcoins significantly. Focusing on sub-wave 4 at our ABC, we see an ABC flat structure as mentioned earlier, with a target of 90k having played out. However, surpassing 109k would boost my confidence. This would confirm we are in impulsive wave 5 and a sub-wave of 5. If we fall back to the 90k area, it means we are forming a regular zigzag, and wave 4 is not done. So, 109k is a critical level to surpass. If we get a strong wave 5, we could see a 40-50% increase (from 89k), reaching Fibonacci levels of 3.272 at $113k, 3.414 at $117k, and 3.618 at $121k. This would be the best-case scenario. However, be aware that the wave could be truncated, meaning it either forms a double top and corrects with a big ABC pattern or fails to reach a new ATH. That's why surpassing 109k is key and increases the probability for a 120k blow-off top! The invalidation point is if we go over $130k; then, this gets invalidated, and a potential target at $170k can be reached, but we need structure to confirm this first, as mentioned.
As mentioned previously, once traditional markets, especially the Nasdaq and S&P 500 tech stocks, correct, Bitcoin is likely to follow, leading to a blow-off top as mentioned before in my other long-term BTC TA. At that point, BTC could drop to $17k-$30k, depending on the peak. This would form a massive ABC corrective pattern with Fibonacci targets at $52k and $31k before finding a bottom. This scenario aligns with a recession-driven market decline, but this is first AFTER wave 5 is done, not before. This takes time to finish the structure.
Invalidation Points:
This scenario could be invalidated if:
1. Markets reset/correct after 1-2 years.
2. Geopolitical tensions or wars are avoided.
3. A recession is avoided.
4. No black swan events occur.
However, if even one of these factors plays out, a market crash becomes highly probable. Be open-minded about these possibilities; ultimately, it is YOUR job to protect your capital.
Weekly Chart:
• Volume: Low volume while price action is increasing, and we are getting close to a bearish divergence if the price goes up to 120k – bearish signal.
• RSI: Close to overbought, showing a bearish divergence since April. This is a high probability given the overbought zone but could be invalidated if RSI reaches 90.
• RSI Stochastic: At level 50 and holding; if it breaks, we could see further downside.
• MACD: Bullish momentum but losing its momentum and getting closer to a bearish momentum, close to a bearish cross. However, both lines above 0 is bullish.
All indicators suggest BTC is gearing up for a blow-off top, but there is still some fuel left.
Daily Chart:
RSI: 60 – bullish
RSI Stochastic: RSI overbought, which is bearish
MACD: Bullish momentum
Volume: Consolidating bullish
Last time I wrote this in the daily: “We are now seeing a more bearish stance, so it aligns with our wave 4 last local drop towards the 90-85k region.”
And it unfolded perfectly. However, we now have a more bullish stance than before, and it looks like it found its bottom. This does not mean we can't have some flushing due to LONG/SHORT dominance, but it's looking more bullish. A 109k surpass and a NEW ATH will confirm this.
Liquidity and Liquidation Heatmap Insights:
Our liquidity and liquidation heatmaps on TradingView reinforce this outlook, showing significant liquidity pools aligning with our targets. Access the same tools at Daily Crypto Trading. Check my profile at the top for access to these tools.
Conclusion:
My conclusion remains consistent since not much has changed, and since 2023, it has been following our projection and plan.
Based on my analysis, I firmly believe that BTC is approaching a top, with a likely range of $120k, especially if the Nasdaq and S&P 500 also peak. This outlook has been consistent since late 2023 and is supported by our Elliott Wave analysis and broader market trends.
However, several factors could disrupt this trajectory:
• Recession: As previously discussed, an economic downturn could align with a traditional market correction, significantly impacting BTC.
• Geopolitical Changes: Major shifts in global politics could introduce volatility, affecting market sentiment and BTC's price.
• Black Swan Events: Unforeseen events can always change market outcomes, as seen in past sudden market shifts.
• Market Shifts: Significant moves in traditional markets, such as those driven by geopolitical tensions or policy changes, could impact BTC.
If we avoid these factors, BTC has the potential to reach as high as $170k, as indicated by our Elliott Wave projections. The strong correlation between BTC and the tech sector suggests that a blow-off top is likely, especially with the current market boost from the "Trump Pump" driven by election cycles. However, potential trade wars or rate cuts could complicate this scenario.
For the short term, We waited for Bitcoin to hit local bottom of wave C around 90-85k, and we hit 89k. Now we are forming what looks more like impulsive wave 5 in the short term. The question is how strong wave 5 will be or if it will be truncated and form a double top? If we surpass 109k, get ready for a NEW ATH of 120k.
In summary, while BTC could reach new highs, managing risk is crucial. The market is full of probabilities, not certainties. Although our targets have been accurate so far, future outcomes are never guaranteed. This analysis is meant to guide your understanding, but always verify and strategize based on your own judgment. #bitcoin #recession
🚨 $BTC Blow-Off Top Alert: Big Move Loading! 🚨
While everyone was screaming that we would never go below 100k, we almost nailed the wave 4 target🎯 The question is: Is wave 4 done? Or will we dip one last time to complete the wave 4 structure towards 85k-75k, or will we hold at 90k before a final push to the upside towards a blow-off top? Let's dive in and check.
Before diving in, I’d appreciate your support with likes, reposts, and comments to help grow the channel and keep this content coming. These analyses take time, and your appreciation fuels the drive to keep sharing. Remember, this TA is based on probability and is not a guarantee; it can be invalidated!
In early December, people were yet again ridiculing others with bearish TA, saying $BTC would "never go below 100k." The same individuals who were extremely bearish at the lows were extremely bullish. These so-called "traders," who have been trading for less than a year, suddenly became TA gurus, giving biased TA that is nothing more than rubbish. Many took my TA and used it as their own after we had these scenarios since 2023, after they ridiculed my TA. Anyway, ignoring the noise, we've been on track.
Let's analyze!
Macro Overview Recap:
If you haven’t already, check out my macro analysis on the inevitable recession. Understanding this is essential before diving into the charts.
Recession: teapawt.org/DailyCryptoTrad/status…
Warren Buffet's Cash Pile: teapawt.org/DailyCryptoTrad/status…
Bitcoin Charts Analysis:
Elliott Wave Theory:
I'm being repetitive, but my Elliott Wave analysis has been spot-on since late 2023 and hit all targets. We are now at the last sub-wave of wave 4, which no one believed would happen, and we dropped almost 16% afterward, where altcoins got destroyed. If we focus on sub-wave 4 at our ABC, we can see an ABC structure forming a so-called zigzag and looking like a normal zigzag where wave C is targeted for around 85k. Now, we could also have what we call a flat corrective wave, which would give a target of 90k. Keep this in mind! It's about being patient now to find a local bottom before a final impulsive wave 5. Wave 5 can be truncated or extended; time will tell, and we will wait for confirmation and structure once wave 4's sub-count is done. If we get a strong wave 5, we could see a 40-50% increase from the $85k level, reaching Fibonacci levels of 3.272 at $113k, 3.414 at $117k, and 3.618 at $121k. This would be the best-case scenario. The invalidation point is if we go over $130k; then, this gets invalidated, and a potential target at $170k can be reached, but we need structure to confirm this first, as mentioned.
As mentioned previously, once traditional markets, especially the Nasdaq and S&P 500 tech stocks, correct, Bitcoin is likely to follow, leading to a blow-off top as mentioned before in my other long-term BTC TA. At that point, BTC could drop to $17k-$30k, depending on the peak. This would form a massive ABC corrective pattern with Fibonacci targets at $52k and $31k before finding a bottom. This scenario aligns with a recession-driven market decline, but this is first AFTER wave 5 is done, not before. This takes time to finish the structure.
Invalidation Points:
This scenario could be invalidated if:
1. Markets reset/correct after 1-2 years.
2. Geopolitical tensions or wars are avoided.
3. A recession is avoided.
4. No black swan events occur.
However, if even one of these factors plays out, a market crash becomes highly probable. Be open-minded about these possibilities; ultimately, it is YOUR job to protect your capital.
Weekly Chart:
• Volume: Low volume while price action is increasing – bearish signal.
• RSI: Close to overbought, showing a bearish divergence since April. This is a high probability given the overbought zone but could be invalidated if RSI reaches 90.
• RSI Stochastic: At level 50 and holding; if it breaks, we could see further downside.
• MACD: Bullish momentum but losing its momentum and getting closer to a bearish momentum, close to a bearish cross. However, both lines above 0 is bullish.
All indicators suggest BTC is gearing up for a blow-off top, but there is still some fuel left.
Daily Chart:
• RSI: Below 50 – bearish.
• RSI Stochastic: Getting close to 50, so still bullish, but breaking below it would be bearish.
• MACD: Very close to a bearish momentum, close to a bearish cross, lines slightly above 0, weak but bullish.
• Volume: Weak with a small bearish divergence – bearish.
Last time I wrote this in the daily: “The daily chart suggests a need for consolidation and finding solid support before another move up. A retracement is likely, aligning with our Elliott Wave (sub-Wave 4) expectation. We are getting overextended.”
And it unfolded perfectly. We are now seeing a more bearish stance, so it aligns with our wave 4 last local drop towards the 90-85k region.
Liquidity and Liquidation Heatmap Insights:
Our liquidity and liquidation heatmaps on TradingView reinforce this outlook, showing significant liquidity pools aligning with our targets. Access the same tools at Daily Crypto Trading. Check my profile at the top for access to these tools.
Conclusion:
My conclusion is the same as last time since not much has changed, and since 2023, it has been following our projection and plan.
Based on my analysis, I firmly believe that BTC is approaching a top, with a likely range of $100k-$120k, especially if the Nasdaq and S&P 500 also peak. This outlook has been consistent since late 2023 and is supported by our Elliott Wave analysis and broader market trends.
However, several factors could disrupt this trajectory:
• Recession: As previously discussed, an economic downturn could align with a traditional market correction, significantly impacting BTC.
• Geopolitical Changes: Major shifts in global politics could introduce volatility, affecting market sentiment and BTC's price.
• Black Swan Events: Unforeseen events can always change market outcomes, as seen in past sudden market shifts.
• Market Shifts: Significant moves in traditional markets, such as those driven by geopolitical tensions or policy changes, could impact BTC.
If we avoid these factors, BTC has the potential to reach as high as $170k, as indicated by our Elliott Wave projections. The strong correlation between BTC and the tech sector suggests that a blow-off top is likely, especially with the current market boost from the "Trump Pump" driven by election cycles. However, potential trade wars or rate cuts could complicate this scenario.
For the short term, Bitcoin is waiting for a final drop towards wave C around 90-85k.
In summary, while BTC could reach new highs, managing risk is crucial. The market is full of probabilities, not certainties. Although our targets have been accurate so far, future outcomes are never guaranteed. This analysis is meant to guide your understanding, but always verify and strategize based on your own judgment. #bitcoin #recession


Tomorrow I will update my long term $BTC TA, but so fare it been following my Elliot wave to the teeth since 2023 from the very top to the corrective wave and only handful of people done the same...

Did you listen ? $BTC
🚨 $BTC Blow-Off Top Imminent: New ATH Incoming! 🚨
Yet again, our TA has proven accurate. As mentioned in my previous Elliott Wave analysis, "we could also have what we call a flat corrective wave, which would give a target of 90k." Now, our flat ABC structure held at 89-90k, and wave 4 is complete. We are now anticipating the final impulsive wave 5. In my earlier conclusion, I also wrote, "For the short term, Bitcoin is waiting for a final drop towards wave C around 90-85k." Anyway, are you ready for a new ATH for Bitcoin?!
Before diving in, I’d appreciate your support with likes, reposts, and comments to help grow the channel and keep this content coming. These analyses take time, and your appreciation fuels the drive to keep sharing. Remember, this TA is based on probability and is not a guarantee; it can be invalidated!
Even though wave 4 is done, the sentiment is overly bullish, which is normally a red flag. So take this with a grain of salt and be cautious!
Let's analyze!
Macro Overview Recap:
If you haven’t already, check out my macro analysis on the inevitable recession. Understanding this is essential before diving into the charts.
Recession: teapawt.org/DailyCryptoTrad/status…
Warren Buffet's Cash Pile: teapawt.org/DailyCryptoTrad/status…
Elliott Wave Theory:
I've mentioned this often, but for our new community members, I'll be a bit repetitive. My Elliott Wave analysis has been spot-on since late 2023 and hit all targets. Previously, I mentioned we were at the last sub-wave of wave 4, which many doubted, and we saw a nearly 12% drop afterward, impacting altcoins significantly. Focusing on sub-wave 4 at our ABC, we see an ABC flat structure as mentioned earlier, with a target of 90k having played out. However, surpassing 109k would boost my confidence. This would confirm we are in impulsive wave 5 and a sub-wave of 5. If we fall back to the 90k area, it means we are forming a regular zigzag, and wave 4 is not done. So, 109k is a critical level to surpass. If we get a strong wave 5, we could see a 40-50% increase (from 89k), reaching Fibonacci levels of 3.272 at $113k, 3.414 at $117k, and 3.618 at $121k. This would be the best-case scenario. However, be aware that the wave could be truncated, meaning it either forms a double top and corrects with a big ABC pattern or fails to reach a new ATH. That's why surpassing 109k is key and increases the probability for a 120k blow-off top! The invalidation point is if we go over $130k; then, this gets invalidated, and a potential target at $170k can be reached, but we need structure to confirm this first, as mentioned.
As mentioned previously, once traditional markets, especially the Nasdaq and S&P 500 tech stocks, correct, Bitcoin is likely to follow, leading to a blow-off top as mentioned before in my other long-term BTC TA. At that point, BTC could drop to $17k-$30k, depending on the peak. This would form a massive ABC corrective pattern with Fibonacci targets at $52k and $31k before finding a bottom. This scenario aligns with a recession-driven market decline, but this is first AFTER wave 5 is done, not before. This takes time to finish the structure.
Invalidation Points:
This scenario could be invalidated if:
1. Markets reset/correct after 1-2 years.
2. Geopolitical tensions or wars are avoided.
3. A recession is avoided.
4. No black swan events occur.
However, if even one of these factors plays out, a market crash becomes highly probable. Be open-minded about these possibilities; ultimately, it is YOUR job to protect your capital.
Weekly Chart:
• Volume: Low volume while price action is increasing, and we are getting close to a bearish divergence if the price goes up to 120k – bearish signal.
• RSI: Close to overbought, showing a bearish divergence since April. This is a high probability given the overbought zone but could be invalidated if RSI reaches 90.
• RSI Stochastic: At level 50 and holding; if it breaks, we could see further downside.
• MACD: Bullish momentum but losing its momentum and getting closer to a bearish momentum, close to a bearish cross. However, both lines above 0 is bullish.
All indicators suggest BTC is gearing up for a blow-off top, but there is still some fuel left.
Daily Chart:
RSI: 60 – bullish
RSI Stochastic: RSI overbought, which is bearish
MACD: Bullish momentum
Volume: Consolidating bullish
Last time I wrote this in the daily: “We are now seeing a more bearish stance, so it aligns with our wave 4 last local drop towards the 90-85k region.”
And it unfolded perfectly. However, we now have a more bullish stance than before, and it looks like it found its bottom. This does not mean we can't have some flushing due to LONG/SHORT dominance, but it's looking more bullish. A 109k surpass and a NEW ATH will confirm this.
Liquidity and Liquidation Heatmap Insights:
Our liquidity and liquidation heatmaps on TradingView reinforce this outlook, showing significant liquidity pools aligning with our targets. Access the same tools at Daily Crypto Trading. Check my profile at the top for access to these tools.
Conclusion:
My conclusion remains consistent since not much has changed, and since 2023, it has been following our projection and plan.
Based on my analysis, I firmly believe that BTC is approaching a top, with a likely range of $120k, especially if the Nasdaq and S&P 500 also peak. This outlook has been consistent since late 2023 and is supported by our Elliott Wave analysis and broader market trends.
However, several factors could disrupt this trajectory:
• Recession: As previously discussed, an economic downturn could align with a traditional market correction, significantly impacting BTC.
• Geopolitical Changes: Major shifts in global politics could introduce volatility, affecting market sentiment and BTC's price.
• Black Swan Events: Unforeseen events can always change market outcomes, as seen in past sudden market shifts.
• Market Shifts: Significant moves in traditional markets, such as those driven by geopolitical tensions or policy changes, could impact BTC.
If we avoid these factors, BTC has the potential to reach as high as $170k, as indicated by our Elliott Wave projections. The strong correlation between BTC and the tech sector suggests that a blow-off top is likely, especially with the current market boost from the "Trump Pump" driven by election cycles. However, potential trade wars or rate cuts could complicate this scenario.
For the short term, We waited for Bitcoin to hit local bottom of wave C around 90-85k, and we hit 89k. Now we are forming what looks more like impulsive wave 5 in the short term. The question is how strong wave 5 will be or if it will be truncated and form a double top? If we surpass 109k, get ready for a NEW ATH of 120k.
In summary, while BTC could reach new highs, managing risk is crucial. The market is full of probabilities, not certainties. Although our targets have been accurate so far, future outcomes are never guaranteed. This analysis is meant to guide your understanding, but always verify and strategize based on your own judgment. #bitcoin #recession
Trump just called tariffs “a very beautiful thing.”
Let’s break this down, because the markets are reacting and your wallet might too.
Spoiler:
Tariffs don’t fix trade deficits. They just shift the cost… to YOU.
1/ 🧵

Remember when I for years warned about #HEX and Richard Heart which is not his real last name ? He is known as the scammer king but when i warned about him his cult attacked me like I was the internationale crime lord 🫠


Daily Crypto Trading retweeted

@DailyCryptoTrad called top well in advance, while doc profits was calling for super cycle $220k. Which doc later switch bear last minute


$BTC just wiped out the longs at $81K. 🎯
Exactly as our Liquidation Tool showed using REAL liquidation data from Hyperliquid.
ALL our trading tools are FREE until Monday!
Get access to EVERY tool by registering a free account in under 1 minute.
Link in the comments below.

Oh well lets make it free a whole week!
Open week on DCT Alpha.
Every Pro tool is free for every account until Sunday 11 October: the Liquidity Heatmap, the Chart with live liquidity and liquidations, the Liquidation Heatmap, Alpha AI and the rest.
No card. Nothing to cancel. Log in or sign up and it's open.
Link in the first reply.
Start here, the live BTC heatmap is free without an account:
dctalpha.com/liquidity-heatm…
Sign up for every coin and every tool until Sunday:
dctalpha.com/register?utm_so…
