

The team at Arbor Data Science provides daily commentary and data-driven analysis for institutional clients of Arbor Research & Trading.
Barrington, IL
Joined December 2018
- Tweets1.6K
- Following34
- Followers12.9K
- Likes980
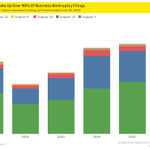




Business bankruptcy filings totaled 26,941 in the 12 months ended 6/30/2026, up 16.9% year-over-year. Chapter 7 and Chapter 11 consistently accounted for more than 90% of business bankruptcy filings from 2021 through 2026.

Muni bond issuance in 2026 remains elevated compared to previous years, with $466 billion worth of muni bonds issued year-to-date, up 9% year-over-year and up 34% relative to 2021.


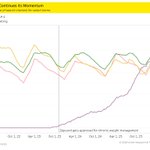
Google search interest in GLP-1s continues to grow. Zepbound was approved for chronic weight management by the FDA in November of 2023. Search interest in GLP-1s surpassed both “working out” and “dieting” in the spring months of 2026 and has held its lead into the fall months.

Looking back to 2012… 1% of new ETFs were leveraged... Fast forward to 2026 – 31.21% of new ETFs use leverage to amplify returns.

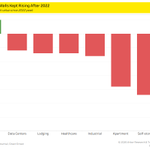
After the CRE market value peak in mid-2022, most properties experienced a decline in private market value. The exception, however, was malls. Since the 2022 peak, private market values for malls continued to edge higher, appreciating 5% from 2022 to 2026.

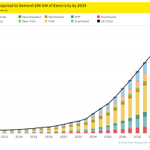
Data center power demand is projected to reach approximately 194 gigawatts (GW) by 2035, over four times the 47.3 GW demanded by data centers in 2025. A majority of that power demand is expected to stem from the PJM interconnection, the largest power grid operator in the U.S.


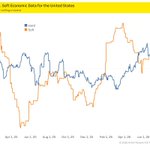
A piece of the puzzle that should not be overlooked – soft data vs hard data. There is a lesson here – pay attention to what the economy is doing, and not always how people feel about it.
@SamuelRines: Macro Strategist at WisdomTree and contributor to Arbor Data Science

19.33% of pending home sales in the San Antonio metro area were cancelled in August 2026. Below are the 20 metros with the highest cancellation rates of the 50 most-populated metro areas.

Equities have historically maintained the largest allocation in family office portfolios, averaging approximately 30% over the last six years. Asset class distribution remained stable over this period, with cash experiencing the sharpest contraction.


Google search interest in “Higher-End Retailers” has climbed in tandem with “In-Store Deals” — underscoring a K-shaped consumer economy where deal-seeking and luxury demand move in lockstep


In July 2026, the three-month moving average of the seasonally adjusted supply of new houses for sale was 9.13 months and the 12-month moving average was 8.80 months. Previously, 8 months or more of housing supply occurred only during recessions.


Younger generations are more likely to view prediction markets as an investment tool rather than pure gambling. One-fourth of respondents in both the 18-34 and 35-44 age ranges viewed prediction markets as investing, notably higher than older age groups.

