

Accounting Technical partner @PwC_Uk, Husband, father of 4, school governor. Likes running, reading, history, science and long walks. Views are all my own.
London
Joined June 2013
- Tweets3.9K
- Following323
- Followers902
- Likes9.8K






Not sure drilling for (relatively) expensive UK gas will make a difference to the global market price that drives our bills. It won't be quick either. The gas component of our electricity supply is down to 28% and falling. Roll on it setting marginal elec price less often.
A bit late to this report but here's an excellent summary of global climate data for 2025, its historical context and the contribution of different factors to it. berkeleyearth.org/global-tem…
Very proud of my daughter, Jo who appeared on Dragons Den last night with her CEO, Rob, looking for funding for Active Hands who provide all sorts of aids for anyone with reduced hand function (whether through back injury, stroke, arthritis and many more). #prouddad #dragonsden

Dave Walters retweeted

I can tell you… Emma has tried the active hands gloves for when she does exercises and they are really good and most important , the Velcro means she can put them on herself. #dragonsden
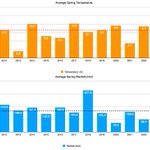
Spring 2025 in Hollywood - by some margin the warmest I've measured (just under 2C above my 2009-25 average). It was - just - the driest spring I've measured at 71.8mm (that's just under 100mm below average) and was my second sunniest spring after the lockdown spring 2020.

Winter 2024/25 was bang on my measured average temperature (2008/9 to date) at 4.7C and about 10% wetter than average at 258mm (vs 226mm). That hides some variations; December was more than 1C warmer than average, with January being more than 1C below. Jan wettest at 102mm.

A most unwelcome trend - this is the number of very wet days a year since 2009 (very wet defined as >10mm in a day). Trend line also plotted. We've had 40 very wet days in 2024 up to date. This year is more than 100mm wetter than its nearest competitor in last 15 years as well.

Interesting graphical summary of 2024 weather -the bottom graph shows the winter/autumn storm season (grey line is pressure!), the 2nd bottom graph is wind gusts (it was our windiest day of year yesterday), the 2nd graph is solar (where has the sun gone since Oct) and top is temp

So we've reached the end of a cooler than recent avg autumn and the wettest one I've measured in the last 16 (see bar chart). Solar energy around 20% below average with light winds too. Compared with '61-90 average locally - autumn 2024 0.4C warmer and MUCH wetter (*2!!)

2024 is now the wettest year I've recorded since getting my weather station in 2008. Still just over a month to go but so far we've had 1078.8mm (compared with my annual average of 816mm 2008-2023). November's rainfall remains 40% short of my November average but gap is closing!
Dave Walters retweeted

Do you ever get the feeling the world’s gone crazy? With this in mind, I play the Flintstones theme in the style of the Russian classics.
November has been very dry so far (1.6mm rain in first 9 days - which is 2% of local average monthly rainfall) but solar energy distinctly lacking; running at around 1/3rd of usual levels thanks to the wall-to-wall cloud we've had - forecast to end soon-ish though!


We've had over 1000mm of rain so far in 2024 at home in Hollywood, Worcestershire. The bar chart shows annual rainfall since 2008 and the local average 1961-90. #wetwetwet

Well done Villa! And a shout out to the Bayern fans who sang all night and responded to the chant in their direction of “you only know one song” by switching and giving us a burst of several others.
Dave Walters retweeted

This is the moment Ratcliffe power station came off the electricity system for the final time, marking the end of 142 years of coal generating electricity in Great Britain!
The story of 2024's missing summer in one bar chart - comparing average temperatures by month for 2024 with the rolling average 2009-24

The story of the wet theme of 2024 so far - comparing rainfall by month with the measured averages 2009-24. Only 2 months so far have below average and most are well above. And yes, I know that September's rain isn't done yet......

