

Official statistics feed for the UK Department for Transport (DfT).
- Tweets1.9K
- Following66
- Followers4.4K
- Likes38





ALT The line chart shows the trend in the percentage of local road that should have been considered for maintenance, for the financial years ending March 2008 to March 2026. • For ‘A’ roads, this figure was 5% from 2008 to 2013, decreasing to 4% in 2014, then falling again to 3% in 2016. It remained at 3% until 2020 when it increased to 4%, in 2025 it increased to 5%, but has since decreased back to 4% in 2026. • For ‘B’ and ‘C’ road, this figure was 8% in 2008, increasing to 9% for 2009, then to 10% in 2011. This then decreased by 1 percentage point each year from 2013 to 2016 when it was 6%. It remained at 6% until 2021, it then varied between 6% and 7%, with the figure sitting at 6% in 2026. • For unclassified roads, this figure was 15% in 2008. It increased to 16% in 2011 and continued to increase by 1 percentage point each year up to 18% in 2013 where it remained until 2016. Since 2016, this figure has varied between 15% and 17%, with the figure sitting at 16% for 2026.


ALT This line chart shows the proportion of people that are satisfied with overall provision across modes by residents of England travelling within Great Britain between 2016 and 2025. In 2015, walking had the highest level of satisfaction with provision with 70%, and local roads had the lowest level of satisfaction with provision with 36%. The proportion of people satisfied with the provision of trains and local buses were similar with 56%. Satisfaction with the provision for cycling (38%) was lower than trains and local buses.

ALT A line chart showing the increase in public EV charging infrastructure over time. As of 1 July 2026 there were 121,171 public EV chargers in the United Kingdom.


ALT A line chart that shows the proportion of heavy goods vehicle (HGV) businesses reporting HGV driver vacancies. In quarter 1 2026, 25% (616 out of 2,424 businesses) of HGV businesses reported HGV driver vacancies, a similar proportion as in quarter 4 2025 (26%, 580 out of 2,242 businesses).

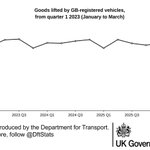
ALT A line chart that shows the quarterly trends of goods lifted by GB-registered vehicles. In the 12-month period ending March 2026, 1.56 billion tonnes of goods were lifted, which remained unchanged from the previous 12-month period ending March 2025 (1.56 billion tonnes).

ALT A line chart of the number fatalities in reported road collisions in which at least one driver was over the drink-drive limit in each year from 2014 to 2024. Each point has error bars representing 95% confidence intervals. There has been an overall increase from 2014 to 2024 with fluctuations in the years between. There were successive increases from 220 in 2020 to 300 in 2022 but there was a 14% decrease from 2022 to 2023. In 2024, there were 220 fatalities, a 16% decrease compared to 2023. However, the confidence intervals for 2023 and 2024 overlap.

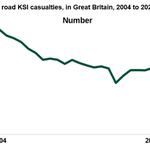
ALT The chart shows the number of killed or seriously injured (KSI) casualties in Road Traffic Collisions in Great Britain, each year from 2004 to 2025. KSI casualties had a steady decline from 47,305 in 2004 to 29,918 in 2025 (excluding the period impacted by COVID-19).


