

The National Drought Mitigation Center at the University of Nebraska-Lincoln helps people everywhere reduce vulnerability to drought.
- Tweets8K
- Following913
- Followers11.5K
- Likes3.1K




ALT USDM Hot Topic October 22, 2026: Texas. dryness or drought categories improved this week: for abnormal dryness or drought, from 95.05% to 91.04%; for moderate drought or worse, from 78.36% to 70.15%; for severe drought or worse, from 47.76% to 45.21%; for extreme drought or worse, from 14.82% to 10.53%; and for exceptional drought, from 1.06% to 0.33%. The graphic includes the current Drought Monitor map for Texas, and the Drought Monitor time series for January 4, 2000, through October 22, 2026. For more statistics, please refer to the US Drought Monitor website: droughtmonitor.unl.edu.

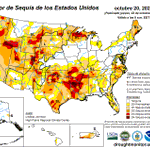
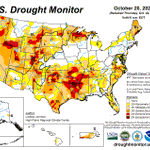
ALT US Drought Monitor showing conditions for October 22, 2026. For more information and drought statistics, visit droughtmonitor.unl.edu.

ALT Side view of a river with trees and sky in the background. The words "Help us see more drought" are in the middle of the image. The graphic is framed by a blue border with the NDMC logo and the website go.unl.edu/cmor_drought at the bottom.

ALT US Drought Monitor. Find maps, data, impacts and more to track #drought and #drought2026. Droughtmonitor.unl.edu. The orange, yellow and red colors of the U.S. Drought Monitor are in the background.

ALT Cattle eating in a pen.

ALT CMOR app showing the location of the report in southwest Arkansas.

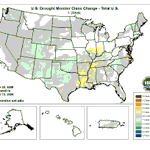
ALT USDM CONUS map for October 15, 2026

ALT USDM Hot Topic October 15, 2026: Southeast. All dryness or drought categories improved this week: for abnormal dryness or drought, from 80.84% to 69.27%; for moderate drought or worse, from 43.56% to 34.2%; for severe drought or worse, from 15.77% to 11.71%; and for extreme drought or worse, from 1.97% to 1.2%. Exceptional drought was removed after covering 0.06% of the region. The graphic includes the current Drought Monitor map for the Southeast, and the Drought Monitor time series for January 4, 2000, through October 15, 2026. For more statistics, please refer to the US Drought Monitor website: droughtmonitor.unl.edu.

ALT US Drought Monitor showing conditions for October 15, 2026. For more information and drought statistics, visit droughtmonitor.unl.edu.


ALT US Drought Monitor. Find maps, data, impacts and more to track #drought and #drought2026. Droughtmonitor.unl.edu. The orange, yellow and red colors of the U.S. Drought Monitor are in the background.

ALT Empty livestock tanks getting filled with water brought in from a truck.

ALT Screenshot of CMOR app showing the location of the report in northwest Arkansas.

ALT Buffalo National River was running low at Steel Creek Campground in Jasper, Arkansas, on Sept. 26, 2026. Brandonrush, CC0, via Wikimedia Commons

ALT USDM Hot Topic October 8, 2026: Colorado. All dryness or drought categories improved this week: for abnormal dryness or drought, from 91.06% to 84.38%; for moderate drought or worse, from 82.3% to 71.46%; for severe drought or worse, from 58.19% to 55.19%; for extreme drought or worse, from 34.98% to 32.94%; and for exceptional drought, from 10.01% to 8.47%. The graphic includes the current Drought Monitor map for Colorado, and the Drought Monitor time series for January 4, 2000, through October 8, 2026. For more statistics, please refer to the US Drought Monitor website: droughtmonitor.unl.edu.

ALT US Drought Monitor showing conditions for October 8, 2026. For more information and drought statistics, visit droughtmonitor.unl.edu.

ALT Train tracks arc through an arid area, with small mountains in the background. The words "Help us see more drought" are in the middle of the image. The graphic is framed by a blue border with the NDMC logo and the website go.unl.edu/cmor_drought at the bottom.

ALT US Drought Monitor. Find maps, data, impacts and more to track #drought and #drought2026. Droughtmonitor.unl.edu. The orange, yellow and red colors of the U.S. Drought Monitor are in the background.