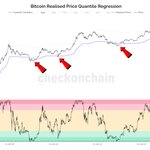

first bear market in bitcoin's history where we never broke below realised price.
2015: -25%.
2018: -40%.
2020: -30%.
2022: -20%.
2026: never.
bitcoin has never had back-to-back down years.
2014: -58% → 2015: +34%
2018: -74% → 2019: +92%
2022: -64% → 2023: +155%
2025 closed -6%. 2026 sits at -6% with ten weeks left. q4 median is +28%.
system caught the move, system left the move. my opinion of fair value was never consulted.
that's the only way to operate.
$BTC
$BTC: 43% below power law fair value.
cheap is a level and the trend is the gate.
$BTC LTH unrealised profit share, trough → today:
2015: 18% → mean.
2019: 35% → mean.
2023: 35% → mean.
2026: 60% → 88%.
each prior cross back through the mean came 9–18 months before the part people remember. the boring stretch is where the position gets built.
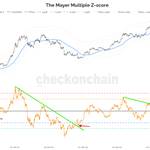
eight years of bitcoin on a log regression channel. seven decisions.
five buys under -1.5σ. three sells over +2σ.
every other day is a hold.
today: -0.94σ. no decision required.
not financial advice. just math.
full interactive chart available free @ durdenbtc.com/charts/btc-tre…
LTH-AVIV crossed back above 1.
how underwater $BTC long-term holders got at each cycle low:
2015: -75%. 2018: -50%. 2022: -45%. 2026: -20%.
either that's diminishing returns showing up early or it's getting harder to make the oldest coins sell.
$BTC is back above every major moving average.
128dma. 200dma. 365dma. 200wma.
first time since the top.
see for yourself, the chart & my entire suite is free: durdenbtc.com/charts/btc-rel…
sixth bounce for bitcoin off the floor of the power law channel since 2013.
the chart keeps doing the thing.
full interactive chart along with my full suite is available free: durdenbtc.com/charts/btc-pow…


