

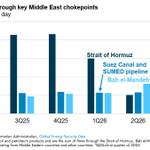


Oil flows through Middle East chokepoints increased 19% in 3Q26. #TodayInEnergy
💻 bit.ly/48sRoLa
🌍 bit.ly/4C7xovb

Working #naturalgas in storage in the Lower 48 states ended the injection season at 3,810 Bcf, exceeding the five-year average by almost 2%. bit.ly/3UYKrye #TodayInEnergy

ALT Chart by the U.S. Energy Information Administration showing natural gas inventories in the Lower 48 states from 2017 to 2026. The bar graph represents inventories on October 31 at season end and April 1 at season start, with net injections during the refill season. Data source noted at the bottom.
Our Monthly Energy Review includes a stock change and other data series, a grouping of items that account for the small differences between supply and demand each month. bit.ly/3V1isxE #TodayInEnergy

ALT Graph showing the difference between surveyed U.S. total energy supply and demand from 1950 to 2025 in quadrillion British thermal units. The demand line, shown in purple, rises steadily above the supply line, in pink. A blue line indicates the difference, representing stock change and other factors, fluctuating close to zero. Data source: U.S. Energy Information Administration.
Alaska's forecast crude oil production to grow by 13% in 2027, the most output since 2014, if realized.
#TodayInEnergy bit.ly/4jdNADr
#STEO bit.ly/4hEUcsM

🆕 Our November Short-Term Energy Outlook with winter fuels update is available now.
💻 eia.gov/steo
It's winter heating fuels season.
🆕 Heating Oil and Propane Update: bit.ly/4qdxOZz
🆕 Winter Propane Market Update: bit.ly/45RAjcS

Refineries have shifted production away from gasoline to middle distillates. #TodayInEnergy bit.ly/4z3QBuV

LNG imports make up increasing share of Colombia’s natural gas supply. #TodayInEnergy #LNG bit.ly/3UvoKFI

EIA retweeted

Christopher Namovicz, @EIAgov's Director for the Office of Electricity, will be joining us at EnergyTech Connect for the panel Getting the Numbers Right: Modeling for an Energy System Under Pressure.
Register: events.usea.org/events/energ…
#EnergyTechConnect26 #Energy #Conference

🆕 Our Electric Power Annual report is now available, with 10+ years of final data through 2025.
💻 eia.gov/electricity/annual/
⚡ Utility-scale electric power generation +2.7% from 2024 to 2025
⚡ Retail sales +2.6% from 2024 to 2025
⚡ Avg residential retail price of electricity + 4.6% from 2024 to 2025
⚡ Net summer capacity: +56,609 MW from new generators in 2025
⚡ Net summer capacity: -5,114 MW due to retirements in 2025

💻 eia.gov/petroleum/gasdiesel/
⛽ Our Gasoline and Diesel Fuel Update posts new prices every Tuesday afternoon.
EIA retweeted

Kudos to Team @EIAgov for navigating PHP patch while simultaneously prepping a successful WPSR release (time to first byte: 2-4 milliseconds) + launching new daily spot prices: eia.gov/petroleum/prices/tab…

In 3Q26, 23% of new light-duty vehicles sold in the United States were hybrid electric, battery electric, or plug-in hybrid electric vehicles, down slightly from 24% in 3Q25. #TodayInEnergy bit.ly/3Wz4DXD


PJM, ERCOT, and SWPP all set peak load records this summer. #TodayInEnergy
⚡ PJM: 162.6 GW, July 2
⚡ ERCOT: 91.1 GW, July 22
⚡ SWPP: 58 GW, July 27
Use our Hourly Electric Grid Monitor to follow near real-time #electricity data.
💻 bit.ly/4dHsryw
💻 bit.ly/4s7bfIt

2Q26 #coal fast facts: bit.ly/4hVbzqp
🔹 Total domestic distribution was 92.2 MMst.
🔹 Wyoming led coal-origin states with 43.2 MMst shipped to 24 states.
🔹 Texas led coal-destination states, receiving about 10.6 MMst of domestic coal.
🔹 About 70% of coal moved by rail, 13.7% by river, and 7.9% by truck.
🔹 About 90% of coal shipped to electric utilities and independent power producers.

EIA expects lower natural gas and propane heating costs this winter. #STEO
💻 bit.ly/4hEUcsM
Register now for the Tuesday, October 13, NASEO webinar featuring our newest Winter Fuels Outlook.
💻 bit.ly/4ARHhMT
Permian Basin output drives U.S. #naturalgas production to all-time high in July 2026. #TodayInEnergy
💻 bit.ly/4xTXSwD
💻 bit.ly/4qhFytz

