

Proprietary VC PMI AI™ market intelligence focused on price, time, and probability. Systems.
Joined March 2012
- Tweets3.6K
- Following1.4K
- Followers913
- Likes100


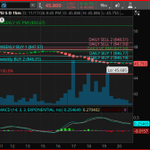
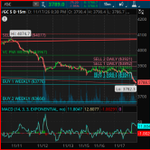


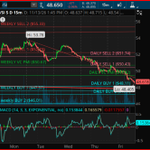
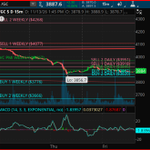
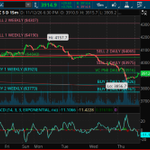

Gold futures remain under pressure, trading near $3,749 after reaching a recent low of $3,721.80. Daily VC PMI resistance stands at $3,774, with Weekly Buy 1 at $3,776. A sustained move above this convergence zone could signal improving momentum. Additional resistance lies at $3,827 and $3,911, while support is identified at $3,687 and $3,666. MACD remains negative, confirming short-term weakness. The December 13, January 12, and February 11 cycle observation dates warrant attention. Central-bank demand, geopolitical uncertainty, and fiscal concerns continue supporting the longer-term fundamental outlook.
Disclosure: Technical levels and cycle dates are reference points, not guaranteed predictions. Futures trading involves substantial risk.

53
Silver futures are trading near $45.63 following a sharp decline to $44.655. The Daily VC PMI mean at $45.75 is the immediate recovery threshold. A breakout above $46.84 could open the door toward $48.63, while weekly resistance remains significantly higher at $50.67. MACD suggests downside momentum may be moderating. The 30-, 60-, and 90-day observation windows extend through December 18, January 17, and February 16. Square of Nine provides an additional geometric price/time framework. Despite short-term pressure from interest rates and dollar strength, silver's industrial and investment fundamentals remain important. Futures trading involves substantial risk.

58
Silver futures are trading near $45.80, below both daily and weekly VC PMI mean levels, confirming short-term bearish momentum. Key support levels are $46.19, $46.01, and the recent low of $45.685. Daily resistance stands at $47.34, $47.93, and $48.51. A recovery above the daily mean would strengthen reversal potential. MACD confirms near-term weakness, although further confirmation is needed. The 30-, 60-, and 90-day cycle observation dates are December 17, January 16, and February 15. Square of Nine provides additional geometric price/time analysis. Despite near-term pressure, structural supply deficits and industrial demand support silver's longer-term outlook. Futures trading involves substantial risk.

68
Gold futures are trading near $3,789, reflecting significant technical weakness. Price remains below the daily VC PMI mean of $3,866 and weekly mean of $3,967. Immediate support is $3,776 (Weekly Buy 1), followed by $3,666 (Weekly Buy 2). Resistance stands at $3,892 and $3,921. The November 27 cycle observation window deserves attention for potential changes in market direction. Square of Nine geometric relationships identify nearby support and resistance references. Despite short-term pressure from interest rates, dollar strength, and liquidation, central-bank demand, geopolitical uncertainty, and fiscal deficits support longer-term gold fundamentals. Futures trading involves substantial risk.

57
Gold futures are trading near $3,873.80, attempting to stabilize following a sharp correction from $4,156. The daily VC PMI mean at $3,864 is immediate support, while resistance stands at $3,893 and $3,933. Weekly resistance is $3,967, with Weekly Buy 1 at $3,776. MACD suggests bearish momentum may be moderating, but reversal confirmation remains necessary. The 30-, 60-, and 90-day cycle observation dates are December 16, January 15, and February 14. Square of Nine levels provide additional geometric reference points. Long-term fundamentals remain supported by central-bank demand, monetary uncertainty, and geopolitical risks. Futures trading involves substantial risk.

37
Silver is approaching a critical technical inflection point after declining from $53.78 to an intraday low of $46.46. Trading near $47.29, prices remain below Weekly Buy 1 at $47.57. Key support is $46.46–$46.01, while resistance stands at $48.43 and $49.99. A recovery above these levels could open the way toward the $50.67 weekly VC PMI mean. MACD is showing early signs of momentum improvement. Upcoming cycle observation dates are December 16, January 15, and February 14. Structural supply deficits and industrial demand support the longer-term outlook, despite near-term volatility.
Disclosure: VC PMI and Square of Nine levels are analytical reference points, not guaranteed predictions. Futures trading involves substantial risk.

42
Silver futures (/SI) are trading near $48.62, below the Weekly VC PMI mean of $50.67, reflecting continued short-term bearish pressure. Immediate support stands at Daily Buy 1 ($48.11), Weekly Buy 1 ($47.57), and Weekly Buy 2 ($46.01). Resistance begins at $50.42–$50.67, followed by $52.33. MACD suggests weakening momentum, although stabilization may be developing. The November 13 price structure places December 13, January 12, and February 11 within the next 30-, 60-, and 90-day cycle observation windows. Structural supply deficits and industrial demand remain supportive longer term, while interest rates and dollar strength present near-term headwinds.

65
Gold futures closed November 13 near $3,886, down approximately 4.38% for the week. The market is attempting to stabilize following a decline toward $3,856. Immediate resistance stands at $3,918 and $3,951, with the weekly VC PMI mean at $3,967. Support is identified at $3,862 and $3,839, followed by weekly Buy 1 at $3,776. Square of Nine geometry identifies important reference areas around $3,918 and $3,949. Higher Treasury yields and inflation concerns remain bearish short-term influences, while central-bank purchases and fiscal uncertainty provide longer-term fundamental support.

49
Gold futures are trading near $3,912 following a sharp correction from $4,157.70 to $3,856.70. The Daily VC PMI at $3,916 represents a critical decision point. Resistance stands at $3,975, $4,040 and $4,065, while support lies at $3,826 and $3,767. Square of 9 geometric levels provide additional price and time reference points. The upcoming 30-, 60- and 90-day cycle windows are December 12, January 11 and February 10. Fundamentals remain supported by central-bank demand, geopolitical uncertainty and sovereign debt concerns, although higher interest rates remain a headwind.
Disclosure: Analytical reference points, not guaranteed predictions or investment advice.

56
Silver futures are trading near $50.45, below the Daily VC PMI of $50.56 and Weekly VC PMI of $51.35, indicating continued corrective pressure. Immediate support stands at $49.18 and $48.28, with a breakdown potentially exposing $46.47. Resistance is $51.46, $52.84 and $54.09. MACD remains negative, confirming weak short-term momentum. Square 9 geometric reference levels include $48.69 and $52.24. The November 15 cycle checkpoint and upcoming 30-, 60- and 90-day cycles warrant attention. Long-term fundamentals remain supported by persistent supply deficits and industrial demand. All technical levels are reference points, not guaranteed outcomes. Futures trading involves substantial risk.

44
Gold is trading near $3,989 following a sharp decline from $4,157.70. Price remains below the weekly and daily VC PMI levels of approximately $4,050 and $4,022, confirming short-term bearish pressure. Daily Buy 1 at $3,968 is the immediate support, followed by Weekly Buy 1 at $3,923. A recovery above $4,022 could signal stabilization, while $4,053 and $4,107 represent resistance. Square of 9 geometric levels provide additional price references. Upcoming 30-, 60-, and 90-day monitoring dates are December 11, January 10, and February 9. Long-term fundamentals remain supportive.
Disclosure: These are analytical reference levels, not guaranteed predictions. Futures trading involves substantial risk.

48
Silver is trading near $51.605, showing renewed selling pressure after failing to hold its $53.78 high. The Daily VC PMI at $52.20 represents immediate resistance, while support sits at Daily Buy 1 $51.22 and Daily Buy 2 $50.44. A breakdown could expose Weekly Buy 1 at $49.21. A recovery above $52.20 would improve momentum and open a move toward $52.98 and $54.09. MACD remains negative, confirming short-term weakness. Square of Nine geometry identifies additional reference levels around $49.84 and $53.42. Longer-term industrial demand remains supportive. Futures trading involves substantial risk.

37
Gold futures trade near 4054.6, hugging the Weekly VC PMI mean (4040) and Daily mean (4069). The model’s five-level structure—Buy 1/2 below and Sell 1/2 above—carries ~90–95% mean-reversion probability at extremes. Cycles link daily-to-weekly fractals; harmonic confluence raises odds. Square of 9 geometry projects angular targets from the 4157.7 high and 3928.2 low that often align with these statistical zones.
Fundamentals remain mixed: elevated real yields and Fed hike odds pressure non-yielding gold, offset by persistent central-bank buying and safe-haven demand.
Disclosure: VC PMI and Square of 9 are quantitative/geometric tools for education only, not guarantees. Futures involve substantial risk of loss.

47
Silver futures (/SI) are trading near $51.70, attempting to stabilize after a decline from $53.78. The Weekly VC PMI at $51.35 provides an important reference, while the Daily VC PMI at $52.05 represents the next upside hurdle. A breakout above $52.98 could open the way toward $54.09 and $54.73. On the downside, $50.30, $49.37, and $49.21 are important support references. Square of 9 geometric levels identify additional price relationships, including $53.51 and $49.91. The December 10, January 9, and February 8 cycle windows warrant attention. Fundamentals remain supported by supply constraints and investment demand, but higher interest rates create risks. All levels are reference points, not guarantees.
Disclosure: Futures trading involves substantial risk. This is not investment advice.

54
Gold futures (/GC) are trading near $4,132.60, above the Daily VC PMI of $4,111, signaling improving short-term momentum. MACD has turned positive, supporting the recovery from $3,904. Key resistance stands at Daily Sell 1 ($4,190) and Sell 2 ($4,207). A breakout could target Weekly Sell 2 at $4,307. Support lies at $4,066 and $4,017, with deeper weekly support at $3,923. Square of 9 levels provide additional geometric price references. The December 9, January 8 and February 7 cycle dates offer monitoring windows. Central-bank buying, debt concerns and geopolitical uncertainty remain supportive fundamentals. Futures trading involves substantial risk.

67
Silver is trading near $53.18, recovering from its recent $48.62 low. The Daily VC PMI at approximately $52.50 and Weekly VC PMI near $51.95 provide important support references. Initial resistance stands at $54.09–$54.72, followed by $56.23. A sustained breakout could strengthen bullish momentum. Downside support is $51.55, $50.40 and $49.21. Square of 9 geometric projections identify potential upside reference levels at $55.00, $56.87 and $58.77. The November 27 and December 27 cycle windows warrant attention. Supply deficits and investment demand remain supportive, although higher rates present risks. All levels are analytical references, not guarantees. Futures trading involves substantial risk.

1
31
Silver near $51.95 maintains a cautiously bullish bias above daily VC PMI $51.84 and weekly mean $51.35. Resistance stands at $52.48, $53.02, and $53.495, followed by $54.09 and $56.23. Support lies at $51.30, $50.66, and $49.21. Square of 9 references from $48.62 identify $52.17 and $55.84. Assuming September 28 as the anchor, upcoming cycle checkpoints are November 27 and December 27. The Silver Institute’s projected 2026 supply deficit supports the structural outlook, although solar substitution restrains demand. silverinstitute.org Confirmation above resistance remains essential. Disclosure: Educational analysis only; futures carry substantial risk, and projected targets or cycle dates do not guarantee results or returns.

38
Gold’s chart price near $4,077 holds above the daily VC PMI mean of $4,075 and weekly mean of $4,040. Sustaining these pivots favors $4,116, $4,156, then $4,190. Below $4,035, downside references are $3,994 and $3,923. Square of 9 calculations anchored at $3,889 identify $4,078, $4,142, and $4,207 as geometric references. Assuming September 28 anchors the cycle, November 27 and December 27 mark observation windows requiring confirmation. Central-bank demand supports the fundamental outlook; higher yields remain a headwind. Educational analysis only: futures carry substantial risk, and cycle projections offer no guarantees. Position sizing and predefined stops remain essential for disciplined risk management.

1
53
Gold’s Doubling Thesis: $11,200 in 2027, $22,400 by 2034!
Gold’s nine-year cycle framework, anchored to August 15, 1971, places the current interval between August 2025 and August 2034. Historical annual averages increased substantially across cycle boundary years, although doubling was inconsistent. Using approximately $5,600 as the first peak, the bullish thesis projects $11,200 by September 28, 2027. Another doubling would establish a potential $22,400 objective by August 2034, requiring approximately 10.6% annual compound growth after the 2027 target. Sustained breakouts and higher lows would strengthen this scenario; prolonged weakness would undermine it. Significant corrections remain possible throughout.
Disclosure: These conditional projections are educational, not guaranteed outcomes or personalized investment advice.

48