

25+ years studying markets. Went full-time. ETF breakouts, theme-first momentum | CANSLIM/VCP/EP style.
Denver, CO
Joined January 2019
- Tweets2K
- Following490
- Followers1.9K
- Likes2.4K


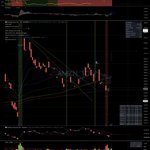

I expect the US market to gap up tomorrow on $NVDA’s after-hours rally. I also think there’s a good chance that gap gets sold in the first 30–60 minutes. The level I’m watching is $164.
That’s where $NVDA bottomed in March 2026. As I write this, it’s trading about $2 below that low. Coming at it from underneath, I expect $164 to be major resistance.
Look at solana:7Lob7rg43kWwmreuxfSTuohun2atBHCXBUkW6KSfpump tonight. It gapped up, pushed higher for the first 30 minutes, then made a new low for the day after the first hour. It’s been a decent crystal ball for the US lately, but I wouldn’t bet on that alone.
If $NVDA tests $164, rolls over and trades below its opening price in the first hour, I’d read that as a likely continued weakness in the $IXIC $SOXX and the general market. If buyers can reclaim $164 convincingly and hold it, that would bode well for the broader market.


17
9,083
What he said.
We never know if it’s going to be a short 1 wave correction or a 3 wave bear market.
Currently $SPX is on its first wave down and $SOXX is on its 2nd.
I exited my final 1/3 of $SPXS and my 2nd 1/3 of $SOXS.
Odds of a strong counter trend rally increase by the day. Could see a waterfall on $SPX first as many sectors $XLE $XLF $XLB and possible even $XLP started rolling over the past day or two
Not picking bottoms. There is plenty of money to be made well after the market bottoms.

David Ryan’s bear market rules are worth revisiting in the current market environment!
David Ryan, a three-time U.S. Investing Champion and student of William O’Neil, shares some valuable lessons:
- Get defensive when your portfolio falls 10-15% from its peak.
- Raise significant cash instead of fighting the downtrend.
- Focus on price action over fundamentals during market declines.
- Understand O’Neil’s three legs of a bear market.
- Don’t try to predict the bottom. Wait for the market to confirm a turn.
A valuable 3-minute lesson for every investor!
Credit @IBDinvestors
15
1,559
Both of my indicators are now on @deepvue. One change from my TradingView setup: $SOXX replaces solana:AvReVQWDjFRHZd4GHYxjztFCTNLX2qMQFbiqa6g6vPq4 in Risk On / Risk Off.
DeepVue doesn’t have cash indexes, so the defaults are $SPY, $ONEQ, $IWM and $SOXX. The first three cover the S&P 500, Nasdaq Composite and small caps. For the fourth spot, I replaced the NYSE Composite with semis. I primarily trade growth stocks, so $SOXX is probably a better fit for me anyway.
You can find both indicators in DeepVue by searching for:
ETF - Risk on / Risk off
ETF - VCP Tightness
The screenshot shows how I use them together, just like I do on TradingView. The VCP Tightness Score shows me how tightly the stock is trading, and the background color gives me a read on the overall market. One glance at the same pane tells me both.


My Risk On / Risk Off indicator turned red on September 10 and has stayed red ever since. The first warning came August 31, when it flipped to Caution and stayed there through September 9.
With @Muninn’s study making the rounds this morning, I’m sharing the TradingView indicator I use to see how many of the major indexes are trending together.
I track $IXIC, $SPX, $IWM and the NYSE Composite (base:0x38f9bf9dce51833ec7f03c9dc218197999999999). Each gets one vote when its daily 10 EMA is above its 21 EMA.
4 of 4 → Green · Risk On
3 of 4 → Yellow · Caution
0–2 of 4 → Red · Risk Off
All four symbols are adjustable. I trade enough semis that I’m considering replacing either $IWM or base:0x38f9bf9dce51833ec7f03c9dc218197999999999 with $SOXX. I’d like to see how often that actually changes the signal.
I use it in the same pane as my VCP Tightness Score, but you can put it directly on your price chart or in a pane you already use.
tradingview.com/script/MPypF…
Do you use @deepvue? I’m bringing both this indicator and my VCP Tightness Score to DeepVue soon. I’ll post here when they’re available.
@RichardMoglen


Almost 2 million views across all my articles so far 🚀🙏 Here's all of them for weekend reading!
MARKET BREADTH
A critical review of different market breadth indicators. Do they even work?
teapawt.org/Muninn/status/20821089…
HOW DOES QULLAMAGGIE ENTER STOCKS?
As one of the most successful retail traders of our time he has a pretty simple entry technique
teapawt.org/Muninn/status/20882927…
HOW DOES QULLAMAGGIE SIZE HIS POSITIONS?
Qullamaggie sizes far less aggressive than Martin Luk. Most of the sizing advice we get as new traders is wrong.
teapawt.org/Muninn/status/20943873…
HOW TO TAKE PROFITS
Every exit has a cost. Selling early, selling into strength and holding on each give up something different.
teapawt.org/Muninn/status/20842742…
EVERYTHING QULLAMAGGIE LEARNED FROM DAN ZANGER
We don't need to reinvent the wheel, but we can't copy blindly. Take what works, dismiss the rest.
teapawt.org/Muninn/status/20904269…
HOW MARTIN LUK TRADES
970% returns in 2025, and over 2100%+ returns YTD. Martin Luk is a future market wizard
teapawt.org/Muninn/status/21176291…
HOW MARTIN LUK MADE 150% IN OCTOBER 2026
This will be mandatory reading for all swing traders in the next 10 years
teapawt.org/Muninn/status/21201598…
Wednesday, X was screaming “Follow Through Day.” I was looking for a short in $SOXX.
Two things stood out on my custom @deepvue intraday dashboard.
• New lows continued to outnumber new highs.
• The strongest themes and industry ETFs were bouncing from oversold levels. Many were already nearing their declining 10/21 EMAs, 50 SMA or 65 EMA.
Where were the growth stocks breaking out to new highs? All day I kept thinking, “This doesn’t feel like an FTD.”
That gave me the confidence to short $SOXX when it rejected its declining 21 EMA. I took the trade through $SOXS using @1chartmaster’s 30-minute pivot tactic in reverse.
I waited for the first green 30-minute candle on $SOXS. When the next candle traded above that first green candle’s high, I bought. My risk on $SOXS was just 0.25 ADR.
I sold ⅓ of the position this morning at +8R.
teapawt.org/ETFbreakouts/status/21…


Follow Through Day! FTD. I'm seeing all over X that it was a follow through day.
Not $SPX. Volume was lower than prior day.
$IXIC. I don't think so, it was up 1.6%, its ADR is 1.7%. I would want to see at least 2.0% up day on increased volume, ideally 2.4% - 1.5x ADRs.
Did it feel like a FTD? Not at all. Healthy FTD have growth stocks breaking out into new highs. This one was primarily beaten up AI stocks rallying off lows more than 50%+ off their highs.
I shorted $SOXX via $SOXS after $SOXX rejected at the declining 21 EMA. Using the 30M Pivot, I shorted 0.67% from today's high. Tight risk only 0.23 ADRs.
Almost every semi looks like a dead cat bounce into declining MA with many lining up with horizontal or resistance areas also.
$SPX and $IXIC both steep bear flags unable to reach the upper trend line and hitting major resistance near their highs today.
52 week lows still out number 52 week highs 235 to 157.
52 week highs led by Pharmaceuticals, Biotechnology & Life Sciences, Health Care Equipment & Services
and Equity Real Estate Investment Trusts (REITs). Not exactly big time growth industries.


Follow Through Day! FTD. I'm seeing all over X that it was a follow through day.
Not $SPX. Volume was lower than prior day.
$IXIC. I don't think so, it was up 1.6%, its ADR is 1.7%. I would want to see at least 2.0% up day on increased volume, ideally 2.4% - 1.5x ADRs.
Did it feel like a FTD? Not at all. Healthy FTD have growth stocks breaking out into new highs. This one was primarily beaten up AI stocks rallying off lows more than 50%+ off their highs.
I shorted $SOXX via $SOXS after $SOXX rejected at the declining 21 EMA. Using the 30M Pivot, I shorted 0.67% from today's high. Tight risk only 0.23 ADRs.
Almost every semi looks like a dead cat bounce into declining MA with many lining up with horizontal or resistance areas also.
$SPX and $IXIC both steep bear flags unable to reach the upper trend line and hitting major resistance near their highs today.
52 week lows still out number 52 week highs 235 to 157.
52 week highs led by Pharmaceuticals, Biotechnology & Life Sciences, Health Care Equipment & Services
and Equity Real Estate Investment Trusts (REITs). Not exactly big time growth industries.
$ANT Anthropic expected on Nasdaq around 11/19/26.
Offering a total of 825 million Class A shares at an estimated price range of $70 to $78 per share. The sale is expected to raise anywhere from $57.75 billion to $64.35 billion.
The company could end up being worth a hefty $1.404 trillion if its shares list at the top of the price range, on a fully diluted basis. That would represent a significant jump up from the $965 billion valuation Anthropic reached in a May fundraise, but it’s still lower than the $2 trillion the company was reportedly targeting a couple months ago.
@TechCrunch
446
Are $SPX, $IXIC and $SOXX close to a tradable bottom? I’m seeing enough signs of selling exhaustion that I’m looking to cover my remaining shorts. Buying is a different decision.
In the video, I walk through two of @PradeepBonde’s short-term momentum indicators using my universe of 1,925 liquid stocks ($25M+ in average daily dollar volume):
• Stocks today up 4%+ or down 4%+
• Stocks past 5 days up 20%+ or down 20%+
The third indicator is my EP9M Up / Down count, inspired by Stockbee’s EP9M setup and a great study posted by @Muninn.
All three are near the downside extremes I saw at the April 2025 Tariff Tantrum low. The difference? That selloff reversed on a headline when Trump paused tariffs. His first TACO.
I don’t expect another TACO to mark this bottom. I think the market still has excess to work off. These readings are enough to have me looking to cover my remaining shorts. Getting long can wait.
Once I cover, I’m happy to sit in cash until a rally back into declining moving averages could give me another short setup.
To get interested on the long side, I want to see a higher low and tighter price action as volatility comes down. Most importantly, I want to see growth stocks setting up to lead the rally. Which industries are starting to produce stocks that break out and hold? As of today, its not Tech!
Stan Weinstein stage analysis is one of the most valuable technical skills to understand. News and earnings are always great during stage 3 tops. Volatile price action (think of all the gaps the markets and big cap stocks were experiencing Aug-Oct) is what stage 3 looks like. Tight orderly price action is what constructive basing before stage 2 continues


Today’s $SPX breakdown looks a lot like the base-on-base top in 1996.
In 1996, $SPX had an accelerated run Jan-Feb, consolidated for 3 months, then broke out and gained less than 4%. It spent another six weeks building a second base before breaking down on 7/5/96.
Look at the run from April to June 2026. Same acceleration, 2 months of consolidation, then a breakout that gained less than 3%. This time the second base lasted 3 months. Today it broke lower.
The low could be today, but its likley 7,150–7,25. Why this area? The upper end of this range lines up with the June low; an area alot of longs are likely using as their stop loss. The market likes to deliver max pain and find important lows to flush out before bottoming. With $SPX around 7,400 near 2 p.m. ET, that zone is around another 3% lower, or roughly 8–9% off the all-time high.
No guarantee this is the bottom though. If this turns into a multi-leg bear market like 2022, this would be the area we see an interim bottom and a rally that lasts weeks and looks convincing right up until it fails (see March 2022 bear market rally, it fooled me). In that scenario, I’d watch the February 2026 highs near 7,000, about 11% off the ATH. If we get a third leg down, the weekly bar of March 30 high puts us near the lower part of the last major base, an area I watch for an O’Neil-style bottom.
Another important analogy that stands out to me about 1996 is how solana:5XqMbyZbtse5UQUzgrYMpeWLWLR6BWFqUm5H3VAWpump lead the $SPX to the downside. The semiconductor index (solana:5XqMbyZbtse5UQUzgrYMpeWLWLR6BWFqUm5H3VAWpump) fell 54% from its Sept 1995 peak to its Jul 1996 low. By the time the S&P 500 ($SPX) finally broke below its trading range, semis were already down 42% and nearing their bottom.
Today, $SPX is breaking lower with solana:5XqMbyZbtse5UQUzgrYMpeWLWLR6BWFqUm5H3VAWpump already 37% off its Jun 2026 all-time high. Another 10% and semis would be near the 50% correction I posted was likely back on October 17.
teapawt.org/ETFbreakouts/status/21…
For as bearish as this post might sound, I think solana:5XqMbyZbtse5UQUzgrYMpeWLWLR6BWFqUm5H3VAWpump is getting close to a bottom. The repeated gap downs on huge volume are starting to look like capitulation. Majority of the constituents are down 10% plus for a 2nd and 3rd day in a row. I can still see $SOXX falling another 10–15% from here to my 10/17 target of $115-$120 area which could happen fast at this pace.
In the meantime, I’ve taken profits on 2/3 my bearish positions $TZA and $SPXS; 1/3 around 11 a.m. ET and another third near 1 p.m. I'll take the balance of profits around the 200 SMA for $SPX


I'm not buying the $SOXX bottom. I'm looking for the ideal short setup when the inevitable premature "bottom is in" calls start coming.
The failed $IXIC breakout and absolute destruction of leading growth stock charts are telling a very different story.
For the past month, arguably three months, price action has been consistent with a major Stage 3 topping process.
And what follows Stage 3? Stage 4.
Look at the leading growth stocks and industry groups. Breakouts have failed everywhere. Many couldn't even complete their bases before breaking down. The consolidation since June is riddled with gaps. Constructive bases have minimal gaps. Constructive price action is tight and orderly with low volume.
At a minimum, I expect $SOXX to shake out the 7/29/26 low of $464. But that would only represent a ~29% correction from its all-time high.
Historically, $SOXX corrections during these types of late stage breakdowns reach 35–50% before a durable bottom forms.
A 35% correction would put $SOXX around $426, another 14% below Friday's close.
But I think a very reasonable potential bottom is the $350 area.
Why $350?
That's near the lower portion of the prior base, a potentially important support area using O'Neil's historical chart concepts.
It would represent a ~47% correction from the highs (very common for $SOXX during market corrections) and another ~29% decline from Friday's close.
Does this mean we're going straight down? Absolutely not.
Today's 20%+ spike in $VIX makes a relief rally next week a very real possibility. Sharp volatility spikes frequently produce short-term rebounds, especially during major downtrends.
In fact, I'm hoping for exactly that.
Give me a 2–3 day, declining-volume dead-cat bounce into resistance the resistance area I highlighted in my video.
That's the kind of short setup I'll be looking for.
Is this another 2022-type bear market? I don't know. But the price action of leading growth stocks certainly has similarities.
I'm not interested in calling the exact bottom. I'm interested in understanding where we are in the market cycle and finding high-probability setups.
Right now, I think the bigger opportunity may be on the short side.
Let the bottom callers have their oversold bounce. I'll be watching to see whether it fails.


Best content on X if you are a swing traders
Just like Qullamaggie, @martinlukkt didn't invent anything new.
He synthesized the best from 6 mentors into his own system.
@jlawstock: showed it was possible for a Hong Kong based trader to trade the US-market
@Qullamaggie: High-ADR leaders, EPs & moving average surfing
@markminervini: Stage 2 trend templates & progressive exposure
@alphatrends: Anchored VWAP from catalyst gaps & swing lows
@PradeepBonde: Episodic Pivots & market breadth awareness
@StanWeinstein: Stage analysis
@jaredtendler: + A/B/C-game tilt control and inch-worm concept.
Full article 👇

3
490
If you’re not seeing this or denying it, you might be in a cult

JON OSSOFF JUST LAID OUT THE WHOLE SCAM IN GEORGIA — AND IT'S BIGGER THAN ONE DEAL.
At his closing rally in Morrow, Georgia, Senator Jon Ossoff walked through it deal by deal. Georgia is listening: he leads Mike Collins 55-40 in the latest poll, and 2.2 million Georgians have already voted.
While Donald cuts a diesel deal with Vladimir Putin — 300,000 tons now, 500,000 in November, a million more after that, while diesel sits at $6.33 a gallon for American farmers and truckers — his own son-in-law Jared Kushner and his envoy Steve Witkoff are brokering the sale of Lukoil's $20-22 billion in international oil fields, refineries and gas stations to the first family's friends.
The buyers, as Jon Ossoff named them: Sheikh Tahnoon bin Zayed Al Nahyan, the UAE's spy chief, who paid $500 million for half of the Trump-Witkoff crypto company days before the inauguration. Moutaz and Ramez Al-Khayyat, the Syrian-born brothers financing Jared Kushner and Ivanka Trump's multi-billion-dollar Albanian resort. And billionaire Todd Boehly leading the consortium. The United States government itself would take a 15% stake — through the same government that is supposed to approve the deal.
Then Marco Rubio: his State Department helped steer up to $1.6 billion in taxpayer backing to the Trump sons' tungsten mine in Kazakhstan — the company's own chief executive says it got 'direct assistance' from Donald Trump, Marco Rubio and Howard Lutnick.
Then Pete Hegseth's Pentagon: a $620 million loan to Vulcan Elements, the magnet company Donald Trump Jr.'s fund invested in three months earlier — the biggest loan that Pentagon office ever gave. And Venezuelan oil money routed through Qatari bank accounts — $500 million in the first sale alone, more than $13 billion taken in by late July.
And Elon Musk? Apartheid Clyde is one of these elites. He spent $475 million buying this election, his companies took $10 billion more in federal contracts since he left DOGE, and his Tesla paid ZERO in federal income taxes on $5.7 billion in U.S. profits. That's why he tells poor people America will end if his side loses. It has nothing to do with them. They are just the infantry for an oligarchy waiting to happen.
This is not a presidency. This is the biggest Ponzi scam in American history — and it is a national security danger, because the men running the State Department, the Pentagon and the negotiating table are cutting resource deals for the family while you pay $6.33 for diesel.
So hear Jon Ossoff's closing line, and hear it like it's real: Raise your right hand. Do you swear to tell the truth, the whole truth, and nothing but the truth, so help you God, in front of the United States Congress? Because next year, that's where this ends. 1 day. EVERYBODY KNOWS IT.
1
2
407
Since I first turned bearish on September 28, $SOXX is down 16% , $SOXL is down 48%, and $IXIC is down 5% through Friday’s close.
The warning signs were there.
Breadth was deteriorating. Breakouts kept failing. Leading growth stocks were weakening while defensive sectors took over.
The index was hiding the damage underneath.
Here’s the timeline, with the original posts:
9/29: Turning bearish near the highs.
Distribution days were piling up, yields were rising, and breakouts kept failing. $SPX was still less than 2% from its highs, but the stocks underneath it were telling a different story.
teapawt.org/ETFbreakouts/status/21…
10/8: Another breakout failed.
The failed $QQQ flag breakout looked like a repeat of August’s failed $SPY breakout. A promising setup, some traction, then gains disappearing.
I said I thought a bear market was coming. My plan was to let my stops take me out and move to cash.
teapawt.org/ETFbreakouts/status/21…
10/15: I was 98% cash.
Growth, $XLK and $SMH looked terrible while defensive sectors rallied. I was looking for a bounce into declining moving averages to potentially short, rather than forcing more longs.
teapawt.org/ETFbreakouts/status/21…
10/17: A bearish $SOXX thesis, with room for a rally.
I outlined a likely shakeout of the July low and the possibility of a much deeper correction. But I also expected a relief rally and wanted a weak, low-volume bounce to short.
Being bearish doesn’t mean chasing prices lower.
teapawt.org/ETFbreakouts/status/21…
10/18: A leading group confirmed a double top.
My custom Technology & Hardware sector was breaking down while defensive sectors took the lead.
When one of the strongest growth groups cracks, I want to see another growth group step up. Defensive leadership wasn’t the confirmation I wanted for a healthy growth rally.
teapawt.org/ETFbreakouts/status/21…
10/22: Still bearish. Still open to a rally.
$SOXX and $SMH were at support. I said they could rally and wanted to see a multi-day bounce toward their declining 21-day EMAs.
A 4 day rally started the next day - 10/23. And it did exactly as I expected, rallied to the declining MA and reversed at he 21 EMA & 30W MA. Exactly as I said the prior day.
teapawt.org/ETFbreakouts/status/21…
I didn’t get every trade right. Failed breakouts cost me money too. And none of these warnings told me the exact day the market would fall or where it would bottom.
But I didn’t need those answers to reduce exposure.
That’s the point of watching breadth, leadership and how your trades are actually working. If you keep getting stopped out while the index is near its highs, pay attention.
I’ll change my stance when the evidence changes. Higher lows, tighter setups, improving breadth and breakouts that hold would give me a reason to become more constructive.
That’s what I share here: my market reads, the tools behind them, and what I’m actually doing with my money.
You don’t have to catch the top or the bottom. You do need enough capital—and confidence—left to act when the opportunities improve.

As bearish as I am, I wouldn’t be surprised to see $SOXX and $SMH rally in the next day or two.
$SOXX is testing its 200-day SMA and the long-term trendline connecting the April 2025 and March 2026 lows.
$SMH also coming down to its 200-day SMA but has broken below its trendline connecting the April 2025 and March 2026 lows.
I’d love to see them rally for a few days back toward their declining 21-day EMAs. For $SMH, a rally back to ~$555to$560 area / the broken trendline and the confluence with the 21 EMA would be an ideal short entry. This level would also close this mornings gap.
teapawt.org/ETFbreakouts/status/21…


Was Friday the bottom for $SOXX? Maybe. Nobody knows.
If your strategy is to guess bottoms and hope, good luck making that work over the long run.
If Friday was the bottom, there should be another opportunity to buy a higher low or a tight consolidation not far from Friday’s close. You don’t need to catch the exact bottom.
When large-cap stocks like $DELL gap down 12% without any apparent company-specific news, that’s a sign of an unhealthy market. This is the kind of price action you see in bear markets, not healthy bull markets.
Long-term investors are playing a different game. If your plan is to hold through corrections and add incrementally, then Friday was exactly the kind of day you should have been buying some. Not panic selling.
Next week could bring another huge selloff or a face-ripping rally. Neither would surprise me.
What would get my attention? A quiet week with volatility drying up and price action tightening. That’s the change of character I’m looking for.
Until then, I’ll manage my short exposure through $TZA and $LABD and let my two remaining longs, $HALO and $KOD, trend until they close below their 10- or 21-day EMAs.
I’m not interested in guessing the bottom. I’m interested in buying when the price action tells me the odds are back in my favor.
Everyone was calling the $SOXX bottom back on 10/16. Not me. Look at my timeline.
Keep guessing bottoms and eventually you'll be right. But it might be an additional 25% down from here.
teapawt.org/ETFbreakouts/status/21…

I'm not buying the $SOXX bottom. I'm looking for the ideal short setup when the inevitable premature "bottom is in" calls start coming.
The failed $IXIC breakout and absolute destruction of leading growth stock charts are telling a very different story.
For the past month, arguably three months, price action has been consistent with a major Stage 3 topping process.
And what follows Stage 3? Stage 4.
Look at the leading growth stocks and industry groups. Breakouts have failed everywhere. Many couldn't even complete their bases before breaking down. The consolidation since June is riddled with gaps. Constructive bases have minimal gaps. Constructive price action is tight and orderly with low volume.
At a minimum, I expect $SOXX to shake out the 7/29/26 low of $464. But that would only represent a ~29% correction from its all-time high.
Historically, $SOXX corrections during these types of late stage breakdowns reach 35–50% before a durable bottom forms.
A 35% correction would put $SOXX around $426, another 14% below Friday's close.
But I think a very reasonable potential bottom is the $350 area.
Why $350?
That's near the lower portion of the prior base, a potentially important support area using O'Neil's historical chart concepts.
It would represent a ~47% correction from the highs (very common for $SOXX during market corrections) and another ~29% decline from Friday's close.
Does this mean we're going straight down? Absolutely not.
Today's 20%+ spike in $VIX makes a relief rally next week a very real possibility. Sharp volatility spikes frequently produce short-term rebounds, especially during major downtrends.
In fact, I'm hoping for exactly that.
Give me a 2–3 day, declining-volume dead-cat bounce into resistance the resistance area I highlighted in my video.
That's the kind of short setup I'll be looking for.
Is this another 2022-type bear market? I don't know. But the price action of leading growth stocks certainly has similarities.
I'm not interested in calling the exact bottom. I'm interested in understanding where we are in the market cycle and finding high-probability setups.
Right now, I think the bigger opportunity may be on the short side.
Let the bottom callers have their oversold bounce. I'll be watching to see whether it fails.
$INTC $50 incoming!
As I posted on 10/17, $INTC looked very similar to the start of the 2022 bear market.
This is why I wait for a higher low and tight price action before buying a falling knife.
And why the market environment matters.
$FTNT gapped down over 20% the day before. It’s one of several stocks getting crushed after earnings.
Then there’s $DELL $CRM $ANET. I was long all three over the past couple of weeks. All three gapped roughly 2x past my planned stop.
You can follow your stops and still take a much bigger loss than planned when stocks gap through them.
When that keeps happening, caution needs to take priority. When 20%+ earnings gaps start piling up, be aware that the bear might be waking up.
New position: Long $TZA for bearish exposure to small caps ($IWM).

The market looks very likely to gap down tomorrow morning.
$SOXX is down 1.8% after hours.
$QQQ is down 1%.
My first reaction? I regret not putting on my $SOXX short before the close.
But then I remembered how many past bottoms have formed. This could actually be an ideal setup for the bulls.
If tomorrow’s gap lower gets immediately bought and we finish the day with a strong close, that would be a very encouraging sign that a bottom may be in.
I’m not predicting that happens. But it’s exactly the kind of price action I’ll be watching for tomorrow.
The reaction to the gap matters far more than the gap itself.
Did $SOXX bottom?
For as bearish as I’ve been, the last few days and a handful of semi charts are keeping my mind open to it.
A huge-volume flush with big gaps lower. A short little flag. Then another gap down on 10/22 on huge volume.
But where was the follow-through to the downside?
10/23: A baby gap lower, a few minutes of selling, then a rally.
10/26: Gapped up and closed in the upper two-thirds of the day’s range. Volume increased versus the prior session and was above average.
10/27: Another gap up, reclaiming the 30-week EMA and closing strong enough to reclaim the 10-day EMA too.
Heavy selling, followed by an inability to push lower, followed by buyers stepping back in. That deserves my attention.
I don’t know if this is THE bottom. But I’ve seen similar price action at enough past bottoms to keep an open mind.
I’ve been bearish. That doesn’t mean I ignore improving price action.
2
16
4,725
Did $SOXX bottom?
For as bearish as I’ve been, the last few days and a handful of semi charts are keeping my mind open to it.
A huge-volume flush with big gaps lower. A short little flag. Then another gap down on 10/22 on huge volume.
But where was the follow-through to the downside?
10/23: A baby gap lower, a few minutes of selling, then a rally.
10/26: Gapped up and closed in the upper two-thirds of the day’s range. Volume increased versus the prior session and was above average.
10/27: Another gap up, reclaiming the 30-week EMA and closing strong enough to reclaim the 10-day EMA too.
Heavy selling, followed by an inability to push lower, followed by buyers stepping back in. That deserves my attention.
I don’t know if this is THE bottom. But I’ve seen similar price action at enough past bottoms to keep an open mind.
I’ve been bearish. That doesn’t mean I ignore improving price action.