

All Time TOP-1 and WIZARD by TradingView 📈 Trader: Crypto, Oil, Prop-Firms 🤝 RWA, On-chain
Global
Joined June 2017
- Tweets3.1K
- Following1.2K
- Followers16.5K
- Likes1.8K








Education post
Trading Formula - 30% Market, 30% Psychology
tradingview.com/chart/BTCUSD…


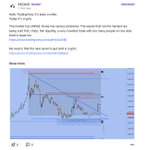
Invalidation: weekly close above 4,750. Triangle dead, 4,900 and 5,600 become targets, I stand aside.
My plan: sell the bounce into 4,400-4,500, stop above 4,750, hold through the floor. Long-term buying starts in 3,090-3,330, in tranches. 10,000 by 2030 still stands.
Full breakdown with the chart and all the receipts: [tradingview.com/chart/XAUUSD…]
Positions, setups and the reasoning before the move, in my Telegram: t.me/+1EMnISfzUSgxMzk1

Long or Short? Cash is King - 20 Oct | Episode 31 |
youtu.be/LPsmu2b0rRo
@tradingview approved my Paid Space.
About 50 authors on the whole platform have one. As of today, I'm one of them.

Context: account since 2016, 2,100 free public ideas, Wizard badge at the end of 2025. You've seen the calls in real time, including this bear market.
Join here: tradingview.com/scripts/mark…
$49/month, cancel anytime from your TradingView settings.

I DON'T SELL DREAMS. I SHOW REALITY WEEKLY UPDATE • OCT 8
youtu.be/TUh9-_fhyvY

Here are all five curves on one chart. Bias: the regime has changed. Easy money in the leaders is behind us. Valuation at 1999 levels (CAPE, the Shiller P/E, at 41), breadth at March 2000 levels (21 stocks at highs). Ten ways it falls, and the honest bull case, in the full post:
tradingview.com/chart/SPX/wc…

What to do: Stop asking if AI is real. Ask what these ten names cost at 40% of the index. Watch into year-end: hyperscaler capex guidance, long yields, and the count of stocks at new highs. The last two cycles took 15 and 34 years to recover. Size for that. Levels for my people: t.me/+1EMnISfzUSgxMzk1
