

I trade everything that moves on binance. Expect to see some of the cleanest charts on CT here. Most of my trades and levels are documented here
Joined August 2020
- Tweets2.2K
- Following528
- Followers459
- Likes3.5K


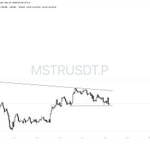

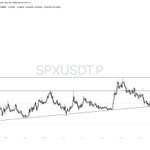
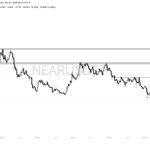



Move along if you're a blind bull, but ethereum:0xaea46a60368a7bd060eec7df8cba43b7ef41ad85 does not look too good here
Lost the $0.19 support earlier
Lost the $0.149 support now
Lost the 50MA
Consistent Lower Lows and Lower Highs
Nothing to be excited on the chart.
We can talk once we reclaim $0.19.

ethereum:0xa12cc123ba206d4031d1c7f6223d1c2ec249f4f3 back at support here.
Entry at the break of the channel looks good.
On my radar


ethereum:0x4a220e6096b25eadb88358cb44068a3248254675 looking good setting up in a rectangle after a massive move earlier
We have to pay more attention to coins which haven't lost much of their gains in the past month.
ethereum:0x4a220e6096b25eadb88358cb44068a3248254675 is still up 180% from the previous breakout
Set your alerts at the break of $212.86
hyperliquid:native rectangle under construction?
Probably a good place to take exposure again.
R:R is favourable here.
I'm entering here with a SL at $76.235

ethereum:0xe0f63a424a4439cbe457d80e4f4b51ad25b2c56c taking support from the ascending lower boundary of the triangle


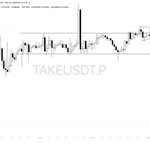
Another attempt by $TAKE at finally breaking out of this flag after the massive move earlier.
Taking a position here
SL: low of the daily candle

base:0x24fcfc492c1393274b6bcd568ac9e225bec93584 respecting the rectangle boundaries so far.
Heading to the upper boundary now.
Would be a great entry at the break of the upper boundary

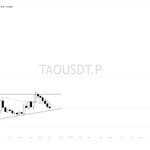
bittensor:native
We're still chopping inside this ascending triangle.
First, we break the trendline resistance
The party only starts on a weekly break of $320.


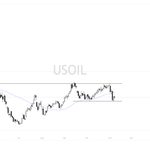
Taking a long on #crude here with a target of upper boundary of the pattern.
SL below the lower boundary

Today is probably a good day to clean your following list based on what they posted yesterday
$BTC


$BTC like expected, taking resistance right from the marked grey zone
My thought is that we break through the resistance area along with the 50MA with one massive candle.
But we trade the price action, not prediction.

bitcoin:native
Multiple resistance levels ahead of us before a new high
For now, it's good to see the $76k area holding strong despite the headwinds from the hack, the stock sell-off, and the election results.
Reclaiming the $81k level should get us back in bull mode.
50MA reclaim will happen soon after


$JASMY holders, you should know Jasmy price action has been one of the worst among all large caps so far
The falling trendline will be the decider of a change in trend.
Nothing to be bullish unless the trendline breaks convincingly
Immediate Resistance- ~0.0042-0.0043 area

$FET
Trend change will be confirmed once we get a close above the upper boundary of this year long channel
Short term - we're forming a doji at support which could trigger the climb towards the channel top again.
Immediate resistance - ~$0.19

$ADA the dump in the past couple of weeks has affected the chart structure a bit
Area of interest remains the same.
On short term, Party begins on break of 0.2850
Long term, $ADA is setting up in a massive 5year long channel.
If the altseason turns out to be as strong as we're expecting, the channel break will trigger a strong rally for multiple Xs in returns.

Weekly close above the marked resistance in gray should set us up for the next leg higher for $ETH
Next resistance - $2560

As simple as that.
Horizontal boundaries for the win

If I am going to be of any help with your journey in charting...
the most important advice I will give is to use horizontal boundaries to generate trade signals.
No indicators, no complicated calculations. Keep is super simple and look for horizontal boundaries with several touch points.
Charts will start talking to you.
Have a good night.