





Pinned Tweet
We ended September on a strong note.
62 Zone Trades Executed.
52 Successful Trades. ✅
An average of 3 zone trades per session.
Here’s the highlight trade from Sept;
We secured both, the swing lows post FOMC at $ES 7,515/22 (ESU) equivalent to 7,575/85 (ESZ) and the swing high at 7,842/48 (ESZ). Both delivered 100 Points.
View the Performance Tracker: docs.google.com/spreadsheets…
Check out the post 👇
#ES_F $ES_F $SPX


We ended August on a strong note.
69 Trades Executed.
57 Successful Trades.
An average of 3 trades per session.
Here’s the highlight trade from Aug;
We secured both, the breakout at $ES 7,660 and the reversal off 7,800/16. Each trade delivered 100 Points.
View the Performance Tracker: docs.google.com/spreadsheets…
Check out the post 👇
#ES_F $ES_F $SPX

We did rock solid this week.
Whether it was the pre-election rotation in $ES or the post-election trend, we've been right in the thick of things.
It's my birthday today, and I'm feeling generous! 🎁
If you want to join us and level up your trading for 2027, drop me a message here. I'll hook you up with something real good.
Here's another note from my $ES Weekly Plan
Pretty much self explanatory
In trend session/sessions you get two trade opportunities;
1) Join the trend using break of Value/IB Period, etc
Watch my 'Trend session recording' for more...
2) Exhaustion. If you know how to measure them, then sharp quick counter rallies are a good point to participate as well.
In today's context, the overnight led rally was good +100-120 Points in ES and ~1,000 Points in NQ. But did that rally result in break of Thursday's Lower Distribution? Not yet.
That tells you who is in control of the auction!
#ES_F $ES_F $SPX

Here's another note from my $ES Weekly Plan
Pretty much self explanatory
In trend session/sessions you get two trade opportunities;
1) Join the trend using break of Value/IB Period, etc
Watch my 'Trend session recording' for more...
2) Exhaustion. If you know how to measure them, then sharp quick counter rallies are a good point to participate as well.
In today's context, the overnight led rally was good +100-120 Points in ES and ~1,000 Points in NQ. But did that rally result in break of Thursday's Lower Distribution? Not yet.
That tells you who is in control of the auction!
#ES_F $ES_F $SPX
You had the precise zones where you could look for $ES Longs. It was shared on Sunday. All you had to do was set 'Orders' and let markets do the rest.
Yes, it's a downtrend. But exhaustion means a sharp counter trend rally on every hit. Good easy take of +120 Points
It's called being prepared. It's called positioning
#ES_F $ES_F $SPX


You had the precise zones where you could look for $ES Longs. It was shared on Sunday. All you had to do was set 'Orders' and let markets do the rest.
Yes, it's a downtrend. But exhaustion means a sharp counter trend rally on every hit. Good easy take of +120 Points
It's called being prepared. It's called positioning
#ES_F $ES_F $SPX
The plan. The zones. All shared were shared with you on Sunday. Zero change.
All we did Monday to Thursday was apply MGI + Teachings to engaged at these structural edges to capture these moves.
Reflect. Reflect hard. This is your moment 💡
Back to the $ES Weekly Plan
Key Points to note;
1) Monday marked the high at Weekly Pivot 7,680s
This particular rejection was an inventory correction into Weekly VAL (Value Gap then) and found responsive sellers.
Question to ask. What do these sellers achieve?
2) ES found buyers at 7,480 - 7,520 region, which was marked as 'Key Decision Point'.
Question to ask. What do these buyers achieve?
Well these buyers rotated back to Weekly VAL/ Weekly Pivot 7,680s
Next question to ask. Can these sellers inflict any damage? Any higher low and a break back inside prior Week's Value is brewing
Observe. All sellers manage is a higher low. Not a random one, precisely at LIS 7,654. That has validated this entire push higher and validated break back inside last week's value was a matter of 'When'
3) Textbook LIS Framework Long at Weekly Pivot/ Weekly VAL 7,694. Confirmed buyers established back inside last week's value.
Think about this...If Gap fill sellers at 7,725/37 meant business, they'd have pulled back and cracked 7,680/94. Instead, turned into a classic LIS Framework Long validating last week's value reclaim and rotated for yet another new session highs.
#ES_F $ES_F $SPX

Back to the $ES Weekly Plan
Key Points to note;
1) Monday marked the high at Weekly Pivot 7,680s
This particular rejection was an inventory correction into Weekly VAL (Value Gap then) and found responsive sellers.
Question to ask. What do these sellers achieve?
2) ES found buyers at 7,480 - 7,520 region, which was marked as 'Key Decision Point'.
Question to ask. What do these buyers achieve?
Well these buyers rotated back to Weekly VAL/ Weekly Pivot 7,680s
Next question to ask. Can these sellers inflict any damage? Any higher low and a break back inside prior Week's Value is brewing
Observe. All sellers manage is a higher low. Not a random one, precisely at LIS 7,654. That has validated this entire push higher and validated break back inside last week's value was a matter of 'When'
3) Textbook LIS Framework Long at Weekly Pivot/ Weekly VAL 7,694. Confirmed buyers established back inside last week's value.
Think about this...If Gap fill sellers at 7,725/37 meant business, they'd have pulled back and cracked 7,680/94. Instead, turned into a classic LIS Framework Long validating last week's value reclaim and rotated for yet another new session highs.
#ES_F $ES_F $SPX
The $ES Weekly Plan had a clear note for 7,470 - 7,520s, i.e; "KEY DECISION ZONE, HOME TO EVENTS"
Midterm Elections, yet another event finds a swing low at the exact same region.
At 03:30GMT team got the confirmation to 'Swing Long'
Come RTH we added at 7,690/7,700
That's +200 Point swing long caught across ETH and RTH.
#ES_F $ES_F $SPX

The $ES Weekly Plan had a clear note for 7,470 - 7,520s, i.e; "KEY DECISION ZONE, HOME TO EVENTS"
Midterm Elections, yet another event finds a swing low at the exact same region.
At 03:30GMT team got the confirmation to 'Swing Long'
Come RTH we added at 7,690/7,700
That's +200 Point swing long caught across ETH and RTH.
#ES_F $ES_F $SPX

$ES 7,618/24 zone was identified ahead of the open.
@LewPayne studies fired the signal around the zone, and the room capitalized on it with a clean short for +20 points.
Preparation. Confluence. Execution.
#ES_F $ES_F $SPX


$NDAQ +20.75%
When we published our research on financial services companies back in July, AI remained the leading sector and firmly in focus, while valuations across financial services had become increasingly depressed. This presented an attractive opportunity, and we identified this gem, among others, at that point.
Now, as Technology undergoes a pullback, these financial services holdings are providing precisely the diversification and portfolio balance we sought to achieve through our allocation decisions.

$WING +31%
We picked Wingstop because valuations had become compelling. Adding the technical picture to the equation, the stock trading into its unfilled Gap between $90–110.
Meanwhile, the AI trade was not only trading near peak valuations, but $SMH had also managed to form a lower high relative to its prior ATH
We recognised that sector rotation was upon us and made some tactical adjustments: trimming gains across our AI basket and rotating capital into non-AI opportunities.

$WING +31%
We picked Wingstop because valuations had become compelling. Adding the technical picture to the equation, the stock trading into its unfilled Gap between $90–110.
Meanwhile, the AI trade was not only trading near peak valuations, but $SMH had also managed to form a lower high relative to its prior ATH
We recognised that sector rotation was upon us and made some tactical adjustments: trimming gains across our AI basket and rotating capital into non-AI opportunities.
$PENG +28.2%
Sentiment is +ve
Catalyst is AI
Business shift is underway
It was all about this quarters numbers and channel checks/alternative data sealed this idea for us.
Add to the fact, PENG was at its prior earnings release low. You had TA signaling a BUY


If you've been following my $ES Weekly Plans then you'd have observed how the Weekly Pivot 7,680s has been unchanged since 3 weeks now...
Last Monday it was the Low before a 100p (pop)
Today (Monday) it is the high and on the way to another 100p (drop)
#ES_F $ES_F $SPX
The $ES Weekly Plan gave you the highs for today
Weekly Pivot 7,682/92
Now 7,618
You had the zone since Sunday.
All you had to do was CLICK. We CLICKED.
#ES_F $ES_F $SPX


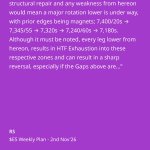
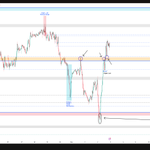
$ES Weekly Plan: 2nd Nov'26
Context
From hereon, the key is to observe whether sellers can continue hold inside last week’s lower distribution and establish value below Friday’s Low OR will buyers emerge after defending August’s value and repair the poor structure above to then reclaim Weekly VAL to end the immediate seller control.
The first sign of aggressive seller strength will be to hold below Friday’s VAH and build value below Friday’s Low 7,558. In the event a rally is seen first, then response to be gauged at Weekly VAL at 7,694. Do responsive sellers emerge upon Gap fill and initiate the next leg down or a weak response results in rotation toward Gap/WNVPOC at 7,725-58.
The immediate focus will be on 7,622 - 7,632, zone that finds confluence with Friday’s VAH...
Check out the weekly plan for more insights 👇
#ES_F $ES_F $SPX

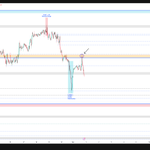
$NQ Weekly Plan: 2nd Nov'26
Context
From hereon, the key is to observe whether sellers can continue hold inside last week’s lower distribution and establish value below Friday’s Low OR will buyers emerge after defending 4M Balance Low and repair the poor structure above to then reclaim Weekly VAL to end the immediate seller control.
The first sign of aggressive seller strength will be to hold below Friday’s VAH and build value below Friday’s Low 28,235. In the event a rally is seen first, then response to be gauged at Weekly VAL at 29,187. Do responsive sellers emerge upon Gap fill and initiate the next leg down or a weak response results in rotation toward Gap at 29,405 and 29,767.
The immediate focus will be on 28,608 - 28,648 zone that finds confluence with Friday’s VAH...
Check out the weekly plan for more insights 👇
#NQ_F $NQ_F $NDX

$ES Weekly Plan: 2nd Nov'26
Context
From hereon, the key is to observe whether sellers can continue hold inside last week’s lower distribution and establish value below Friday’s Low OR will buyers emerge after defending August’s value and repair the poor structure above to then reclaim Weekly VAL to end the immediate seller control.
The first sign of aggressive seller strength will be to hold below Friday’s VAH and build value below Friday’s Low 7,558. In the event a rally is seen first, then response to be gauged at Weekly VAL at 7,694. Do responsive sellers emerge upon Gap fill and initiate the next leg down or a weak response results in rotation toward Gap/WNVPOC at 7,725-58.
The immediate focus will be on 7,622 - 7,632, zone that finds confluence with Friday’s VAH...
Check out the weekly plan for more insights 👇
#ES_F $ES_F $SPX
$NQ Weekly Plan: 2nd Nov'26
Context
From hereon, the key is to observe whether sellers can continue hold inside last week’s lower distribution and establish value below Friday’s Low OR will buyers emerge after defending 4M Balance Low and repair the poor structure above to then reclaim Weekly VAL to end the immediate seller control.
The first sign of aggressive seller strength will be to hold below Friday’s VAH and build value below Friday’s Low 28,235. In the event a rally is seen first, then response to be gauged at Weekly VAL at 29,187. Do responsive sellers emerge upon Gap fill and initiate the next leg down or a weak response results in rotation toward Gap at 29,405 and 29,767.
The immediate focus will be on 28,608 - 28,648 zone that finds confluence with Friday’s VAH...
Check out the weekly plan for more insights 👇
#NQ_F $NQ_F $NDX
Folks!
For those of you who are interested in learning and looking to build an edge in your trading using non-correlated confluence. Here's your opportunity.
Offer ends within 4 hours (240mins). We've got less than 6 codes left out of the 100 that were initially set out.
$ES #ES_F $ES_F $SPX
Here it is... what many have been waiting for; a clear path forward for both new and intermediate traders, and a thriving community for advanced traders wishing to learn more. Everyone, regardless of level, can now join the EdgeByRS server and get access to not only my Savant Trading live chart stream and commentaries, but also the full EdgeByRS curriculum for new and intermediate traders. That's right... a path forward, all for one membership fee, on one discord server.
You can obtain a substantial discount by viewing the video I've prepared for you, and following the instructions. You're also welcome to skip the video and pay full price, of course - but I wouldn't.
Am I good at marketing? Laughably, no! Am I good at markets? Yes! What do you want... a person good at marketing, or a person good at markets? Watch the video; take the discount, and come under our joint mentorship wing.
youtu.be/TxOJJkNDp0U

Trend days are where most traders get it wrong.
Friday's $ES gave 3 bearish clues before the bell:
→ Gap down
→ Open below last week's Weekly VAL
→ Balance breakdown (RS Custom Balance Range)
Full walkthrough: the context, the entries, and how intraday singles warned the move was about to accelerate 🎥
Bookmark this for your next trend day. 🔖
#ES_F $ES_F $SPX
A trend down session $ES $NQ
I'm certain it caught a lot of folks off guard
Every spot came across as a 'bottom catching' event
In tomorrow's recording I'll breakdown how "MGI" alone was sufficient to be on the right side of the auction.
#ES_F $ES_F $SPX $NDX
At 10:24 GMT this morning...
Team had one message "You may want to measure 100% Extn of the lower Distribution"
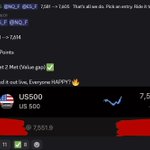
Come Friday London Session, we identified a LIS Framework Short setup + Balance Breakdown Active (Balance Rules). Since then one way down +500 Points
This is the same $NQ lower distribution, I shared with you folks on Sunday. Scroll down. It was noted in the weekly plan.
#NQ_F $NQ_F $NDX


At 10:24 GMT this morning...
Team had one message "You may want to measure 100% Extn of the lower Distribution"
Come Friday London Session, we identified a LIS Framework Short setup + Balance Breakdown Active (Balance Rules). Since then one way down +500 Points
This is the same $NQ lower distribution, I shared with you folks on Sunday. Scroll down. It was noted in the weekly plan.
#NQ_F $NQ_F $NDX
