

I turn coffee into trading ideas. Futures, CFDs, Substack retests. Code in our free Discord: https://xitter.cf/t.co/MUxa9QiOHe. Not advice.
Backtests, not signals
Joined September 2021
- Tweets400
- Following46
- Followers27
- Likes90


Pinned Tweet
We take public trading rules and test them properly: rebuilt in code, real costs, 11 checks.
Every day on Substack: one rule, its equity curve, its worst drawdown, and the code.
Free: empiricalab.substack.com

Taleb: success "requires survival but not the other way around."
Two of our futures strategies ended their backtests with solid profits. Both would have broken a prop firm's trailing drawdown on the way. Only the day-by-day equity curve showed it.
I judge the path first.

Another red index day, another green short. Oct 22: Nasdaq-100 −2.90% close-to-close. My US100 CFD short: ~29,060 → ~28,890, about +170 points. MT5 chart unchanged. Still a single trade, nowhere near a track record. NDX source: chartexchange.com/symbol/ind…

How I test the rules behind trades like this, with costs and checks on data the rule has never seen, free: empiricalab.substack.com
The longer you hold SPY, the more lopsided its returns get.
Skew of log returns since 1993: −0.25 by day, −0.74 by month, −0.92 by quarter. Day to day it is close to symmetric. Over quarters the bad side dominates.
Descriptive, not a backtest.

More on SPY's tails, day by day and quarter by quarter, free: empiricalab.substack.com
The textbook RSI(2) setup adds a 200-day trend filter. On ten big US stocks since 2020 it earned less on 9 of 10.
Meta 1.3x instead of 2.2x, Apple 1.25x instead of 1.6x. Only Tesla gained, 0.96x vs 0.94x. (That version also exits on the 5-day average.)
Backtest.

Every variant we tried on these ten stocks, with the numbers, free: empiricalab.substack.com
A red index day. A green short.
Oct 16: Nasdaq-100 −2.50% close-to-close.
My US100 CFD short: ~29,410 → ~29,240, about +170 points. MT5 M1 chart unchanged.
One trade, not a track record.
NDX source: chartexchange.com/symbol/ind…

I fixed the weights of my 20-rule portfolio on data to June 2023, then measured the three years after.
11.3% a year, Sharpe 1.73, worst drawdown 5.3%. SPY made 18.9% a year with an 18.8% drawdown.
Backtest with costs. What it holds and the catch below.

The catch I can't test away: 37.5% of the weight sits in rules on three stocks that turned out to be winners of the period.
In 2020 nobody knew that.
Today's subscriber edition has the eight rules with weights and sources, the frozen-weight test, three checks and the full code: empiricalab.substack.com/p/s…
If a backtest shows one cost level only, I read it as a pitch.
We reran 49 rules from trading newsletters with our own cost model. 47 made money after costs. At triple costs, 43 still did.
Triple costs is the first stress I run, before any Sharpe ratio.
Backtests.

Volatility has memory.
After SPY's calmest 20-day stretches, the next 20 days ran at 10% annualized volatility. After the wildest: 26%.
Prices are hard to forecast. Risk much less so.
Descriptive, SPY daily 1993 to 2026.

By late morning in New York on Thursday: +$4,247.12 on MNQ, across prop accounts that all copy one automated strategy. No clicks.
The part screenshots skip: a copier copies the bad weeks too. In our simulation, 80 to 100% of copied accounts breached in the same week.

The math of copied prop accounts, and why they don't replace a portfolio of your own: empiricalab.substack.com/p/m…
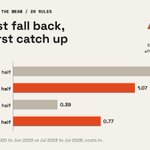
We split 20 of our rules into two halves of about three years.
The 5 best of the first half fell from a Sharpe ratio of 1.45 to 1.07. The 5 worst rose from 0.39 to 0.77.
Luck fades. Judge a rule on its full history.
Backtests with costs.

Why last year's best rules disappoint next year, with the data: empiricalab.substack.com