

Tech Talk is a free stock market letter service available at https://teapawt.org/t.co/BJV0N7vrq2 and https://teapawt.org/t.co/qBCl3egWXc. Ask us about the Seasonal Advantage Portfolio.
America
Joined December 2009
- Tweets14.4K
- Following423
- Followers10.1K
- Likes413




Pinned Tweet
Out now…
Our monthly report for November is available for download, providing insights, analysis, and trade ideas to navigate the market through the month(s)/year ahead.
Subscribe now to receive this 111-page report: charts.equityclock.com/subsc…
#Stocks #Bonds #Commodities #Gold

Rate, Dollar, and Crypto headwinds weighing on broader risk sentiment, causing investors to look to deleverage. equityclock.com/2026/11/16/s… $AGG $UUP bitcoin:native

2
779

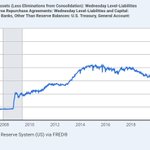
Much of the move (negativity) in the market can be chalked up to a consensus unwind and a rollback of highly leveraged positioning (particularly in Technology). When margin debt rolls over on a multi-month basis (as it is now), it is typically signal that the goose is cooked and the bull market is over. After a few years of a larger than average expansion in margin debt in portfolios (a pace that exceeded the returns of the broader equity market), the inability of this gauge of leverage to exceed the spring highs (diverging from the path of the broader equity market) sends a strong warning pertaining to risk sentiment for the months ahead. $SPY $QQQ

If you just want to ignore all of the dynamics in the market (which are important to us in our process), all you need to know is that the short-term path of the S&P 500 remains that of lower-lows and lower-highs. Difficult to be aggressive in risk while this is playing out. We are anxious to put money to work and become risk-on again, but the market has provided numerous cues to suggest patience is prudent. $SPX $SPY $ES_F

Who would’ve thought that Transports $IYT get lumped into the defensive rotation. This has been one of the segments that we have been pointing subscribers towards. Transportation stocks seasonally strengthen into the end of the year amidst the decline in energy commodity prices and everything has aligned favourably for this trade over the past month.


Defensive sectors $XLP $XLU $XLRE $XLV topping the leaderboard today as the market remains in this risk-off mode. We have been expressing caution towards the broader market for the past month. The framework to promote the positivity in the equity market that is seasonally typical at this time of year has been absent, but we are keeping our subscribers on top of the cues and timing to become risk-on again.

2
707
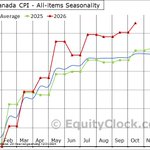
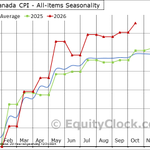
Overall consumer prices (CPI) remain on a hot trajectory in 2026, fuelled by the high price of energy commodities through the month of October. However, focusing on the core (ex food and energy), the Canadian Consumer Price Index is showing a normal pace, higher by 2.2% YTD through the end of October amidst strains in the consumer economy. $STUDY $MACRO #CDNecon #CAD


2
707
Seasonally, this is supposed to be the strongest time of the year for Bitcoin bitcoin:native. If traders cannot rally the crypto market, how are they going to rally the equity market for the normal year-end positivity? The downfall of crypto has been presenting concern for broader risk sentiment. $SPY

1
7
955
Tough weekend in the crypto market. We are coming up to some critical levels for Bitcoin bitcoin:native around its 200-week moving average, the hurdle that has worked to support the long-term trend over its history. A failure here would be problematic for broader risk assets. ethereum:native solana:So11111111111111111111111111111111111111112 $SPY

Weekend Wrap:
Last week, the S&P 500 gained 2.51%, recovering much of the prior week’s decline. Previous support at the 20-week moving average (7621) is being tested as resistance, confirmation of which would inevitably result in a test of the 50-week moving average (7255). MACD remains on a weekly sell signal and it has been negatively diverging from price since August. The market is certainly lacking vigor heading towards the end of the year, something that has been emphasized by the collapse in dark pool buying activity in recent weeks. We have been exercising our caution on the market in our portfolios, a few weeks ago rotating exposure away from the Tech-heavy S&P 500 Index ETF $SPY and into a fund that continues to chart 52-week highs, outperforming the market.
$SPX
For trade ideas and ways to allocate your portfolio, subscribe to receive our daily reports: charts.equityclock.com/subsc…

1
775
Backdrop remains unfavourable to become aggressive in broad risk exposure at this time. We’ll tell you what we’re steering our portfolios towards: equityclock.com/2026/11/13/s… $SPY $XLV $XLI $XLY

1
725
Consumer Discretionary $XLY, the worst performing sector of the past couple of years, just does not want to move above significant horizontal resistance at $121.
Should we start to see some of these groups that have held up well in recent weeks amidst the Tech-wreck roll over from levels of resistance, like this, without the rotation towards recent laggards (eg. $XLK ), volatility in the equity market would ramp up considerably.

A lot of portfolio managers are promoting their love for Health Care $XLV (and we have advocated our subscribers to Accumulate exposure for many months), but with this becoming a consensus trade, prices stretched well above levels of support, and very early hints of upside exhaustion, it is probably inappropriate to be aggressive with new allocations, particularly during the mean reverting phase in the market in December. We have been playing the sector through the $IHE $IHF ETFs.

4
703
A lot of indecision in the $VIX at the rising 50-day moving average, but, ultimately, the rising trend persists, unfavourable to promote stability in the equity market.

The high price of energy commodities has certainly been influential in manufacturing sales in Canada through the first three quarters of this year. Sales of Goods Manufactured in Canada have climbed by 22.4% (NSA) year-to-date through the end of September, more than double the 10.7% rise that is average for this timeframe. $STUDY $MACRO #CDNecon #CAD

3
638
Despite a normal October decline in the energy category, the Producer Price Index (PPI) remains on a rapid climb this year. PPI for Final Demand is up by 6.3% (NSA) year-to-date through the end of October, more than double the 2.9% rise that is average for this timeframe. Strength in the capital equipment, transportation, and services categories are the factors behind this hot pace. $STUDY $MACRO #Economy #Manufacturing #PPI

Running down some of the key coincident indicators of economic health (and the stability of the equity market): equityclock.com/2026/11/12/s… $SPY $QQQ

3
1,245


This is a logical point for volatility to pickup again as the $VIX tests its rising 50-day moving average. Need to see this rising path in the so-called “fear gauge” break before we can become confident that the market is moving past this period of weakness and starting to realize the type of positivity that is average for the end of the year.

5
830
Certainly is a warning sign to the equity market, growth in particular eg. $QQQ , that cryptocurrencies are struggling to find support. bitcoin:native ethereum:native

3
730