

Fundamentals-driven equity research. Signal over noise. High quality research reports on 5000+ U.S. stocks, big and small: https://teapawt.org/t.co/fe2Bem0E8b
Joined December 2025
- Tweets2.6K
- Following118
- Followers346
- Likes39
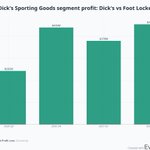






Dick's Sporting Goods acquired Foot Locker in 2025. Foot Locker's segment profit has swung wildly since: -$46.3M (quarter ended Nov 2025), -$5.9M (Jan 2026), +$17.5M (May 2026), then back to a -$31.9M loss in the quarter ended August 2026. The legacy Dick's segment hasn't missed once, posting $485.2M in profit that same quarter alone.
$DKS

1
39
Full Dick's Sporting Goods segment history including Foot Locker: everyticker.com/quote/DKS/fi…

16
$RCL hit a record net yield of $288.95 per cruise day in Q2 2026, up 1.9% from $283.56 a year earlier. Net cruise costs excluding fuel rose more than twice as fast, up 4.4% to $132.30 from $126.76 over the same year. The pricing record isn't keeping pace with cost growth.

1
37
Full Royal Caribbean segments and KPI history, including net yields, cruise costs and occupancy: everyticker.com/quote/RCL/fi…
16
Five Below's comparable sales fell to -5.7% last year, one of its worst quarters ever. The next six quarters: 7.1%, 12.4%, 14.3%, 15.4%, 22.7%, 14.1%. A comp slump flipped into the strongest same-store sales streak in company history. $FIVE

Full comparable sales history and segment detail for $FIVE: everyticker.com/quote/FIVE/f…
11
Starbucks just swapped turnaround leaders. North America comp sales: 0.0% then 4.0% then 7.1% over the last three quarters. China comp sales: 2.0% then 7.0% then just 0.5% over the same stretch. China sparked the recovery first. The US is carrying it now. $SBUX

1
1
52
Full North America and China comparable store sales history with primary filing sources: everyticker.com/quote/SBUX/f…
1
17
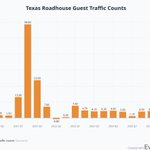
Texas Roadhouse's guest traffic growth slowed to 3.0% in Q2, down from 4.0% a year ago. Comparable restaurant sales still grew faster, accelerating from 5.9% to 6.5% over the same stretch, because rising menu prices are doing more of the work than new diners walking in. $TXRH

2
42
Full guest traffic and comparable sales history: everyticker.com/quote/TXRH/f…
13
$EXPE's B2B travel segment posted a $208 million adjusted EBITDA loss in 2020. By 2025 it generated $1.26 billion in adjusted EBITDA on $4.8 billion of revenue, a nearly $1.5 billion swing in five years as margin moved from negative 22% to 26%.

1
30
UGG has outsold Hoka inside Deckers for years. That lead is quietly shrinking.
FY2025 revenue: Hoka $2.23B, UGG $2.53B, a $298M gap.
FY2026 revenue: Hoka $2.59B, UGG $2.74B, gap down to $151M.
Hoka grew revenue almost twice as fast as UGG this year. $DECK

1
57
Full Hoka and UGG segment revenue, margin and KPI history: everyticker.com/quote/DECK/f…
25
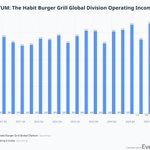
$YUM has owned The Habit Burger Grill since 2020. It has posted only one profitable year since: 2021's $2M. Operating income was -$22M in 2020, -$24M in 2022, -$13M in 2025, negative in five of six years. Taco Bell's operating income over the same stretch grew from $696M to $1.13B, up 62%. One acquisition still hasn't worked. The core brand keeps compounding.

1
31
$DPZ's smallest reporting segment has quietly become one of its best profit engines. International Franchise, essentially royalty collection with almost no infrastructure behind it, grew segment income from $41.6M in Q1 2018 to $91.9M in Q4 2025. That's now roughly 25% of Domino's total segment income, generated by the segment that needs the least capital to run.

1
58
$BBY's international segment made more operating profit in its holiday quarter alone than in the prior three quarters combined. Adjusted operating income: Q1 $4M, Q2 $18M, Q3 $28M, then Q4 $65M. Domestic stayed far more balanced, $329M to $360M before a $630M Q4. International profit is almost entirely a holiday season event.

1
36
Full Best Buy segment KPI data and filings for $BBY here: everyticker.com/quote/BBY/fi…
13