

Drive your investment success with intelligent analytics.
London, England
Joined May 2017
- Tweets2.3K
- Following262
- Followers3.4K
- Likes859
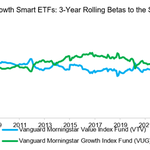
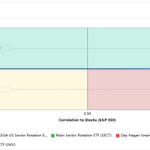
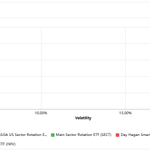

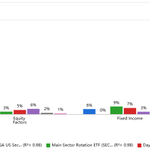


The Impact of Market Beta on Smart Beta Performance.
Does it matter?
insights.finominal.com/resea…

Product Review: Sector Rotation Funds (FV, XLSR, SECT, SSUS, AESR, NAVFX). What's the strategy?
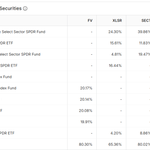
We select U.S. sector rotation funds with at least 5 years of track record, namely the First Trust Dorsey Wright Focus 5 ETF (FV), State Street SPDR SSGA US Sector Rotation ETF (XLSR), Main Sector Rotation ETF (SECT), Day Hagan Smart Sector ETF (SSUS), Anfield US Equity Sector Rotation ETF (AESR), and Navigator Sector Rotation Fund (NAVFX). They charge management fees between 0.30% (FV) and 1.91% (NAVFX), and collectively manage $9bn.
FV, XLSR, and SECT are always 100% invested in equities, while SSUS, AESR, and NAVFX are tactical and can move to cash & equivalents. All aim to outperform the U.S. stock market primarily through sector rotations, although strategies differ. Currently, they are all close to 100% allocated to U.S. equities.
finominal.com/asset-comparer…

The risk-adjusted returns over the last 6.8 years are also disappointing, as only one fund, the Day Hagan Smart Sector ETF (SSUS), has generated a higher Sharpe ratio than the U.S. stock market (0.62 vs 0.53).
finominal.com/asset-comparer…

How should investors think about these funds?
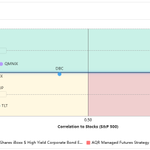
These funds offer little diversification benefit, as their correlations with the S&P 500 range from 0.89 (FV) to 0.97 (XLSR). Except perhaps SSUS, they offer lower returns and Sharpe ratios than the S&P 500 and represent unattractive equity exposure. Notably, there is little difference between funds that always hold 100% equities and those that can allocate to fixed income.
finominal.com/asset-comparer…

Fund Selection: Equity Substitutes vs Diversifiers.
What funds are worth buying?
insights.finominal.com/resea…

Portfolio Review: The Cockroach Portfolio. What is the investment strategy? We're analyzing a portfolio based on the investment philosophy of the Cockroach Fund run by Mutiny Funds. RCM Alternatives described the portfolio construction as comprising equal allocations to global equities, global bonds, long volatility, and trend-following strategies, with a dash of gold and crypto. The article was published in 2021, so we have five years of out-of-sample performance.
rcmalternatives.com/2021/09/…

Which funds were the major risk & return contributors?
Global equities generated most of the returns, followed by managed futures. However, cryptocurrencies also contributed significantly for a 2.5% position. GBTC's marginal contribution to risk was 47%, and it accounted for 25% of total risk, given Bitcoin's volatility over the last decade.
finominal.com/portfolio-anal…

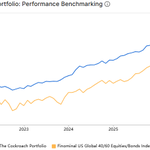
What was the out-of-sample performance? The article on the Cockroach portfolio was published on September 1st, 2021, and most complex portfolios perform poorly out of sample. However, in this case, the portfolio has generated a higher return (6.7% vs 4.0%) and Sharpe ratio (0.77 vs 0.03) than the benchmark index since then, primarily due to poor bond performance. Naturally, you could switch to an all-weather benchmark, but that introduces the risk of benchmark optimization. Long live the cockroaches.
finominal.com/portfolio-anal…

Bonds vs Gold vs Managed Futures: A 25-Year Perspective. Rethinking traditional asset allocation.
insights.finominal.com/resea…

Product Review: Momentum vs Growth ETFs (SPMO vs VUG). What's the strategy & portfolio composition?
On Bloomberg or CNBC, talk show hosts often use momentum and growth stocks interchangeably, but they are two distinct strategies. We use the Invesco S&P 500 Momentum ETF (SPMO) and the Vanguard Growth ETF (VUG) as case studies. SPMO selects the top 100 momentum stocks from the S&P 500, and scales the score by volatility to identify consistent outperformers. VUG selects large-cap stocks based on expected and historical EPS & sales growth, along with two quality metrics. SPMO holds roughly 100 stocks and charges 0.13% pa, compared to 150 stocks and 0.04% for VUG.
finominal.com/asset-comparer…

How have the funds performed? We have only 11 years of common track record: VUG outperformed significantly from 2020 to 2022, and SPMO from 2024 onward. Both have outperformed the S&P 500 since 2015. SPMO also generated a significantly higher Sharpe ratio of 0.82, compared to 0.71 for VUG and 0.72 for the S&P 500.
finominal.com/asset-comparer…

We can extend the analysis to 2004 using the Finominal USA Momentum and Growth Indices. This changes the perspective, as growth stocks have generated higher absolute returns and Sharpe ratios than the U.S. stock market and momentum stocks. We can attribute momentum stocks' poor long-term performance to their much worse 2009 performance, when stocks started recovering after the GFC. However, the long-term evidence for growth stocks shows that there is no positive excess return associated with them. The starting point for the indices in 2004 is also before the tech bubble implosion, when growth stocks performed poorly.
finominal.com/asset-comparer…
