





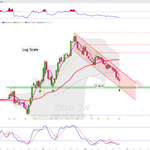


$OKLO 3 years in monthly candles. For entertainment purposes only ... but one of these days ... the cycle will change ...

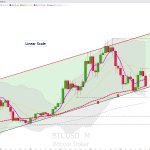
$BTC.X Monthly chart so far. The price is testing again its monthly SMA50 ... and the long term channel support is only half inch below ... 🧐


$ASTS We’re in the middle of the month... let’s see how that monthly candle closes. Pray to the gods for a long lower wick. 🙏 Monthly candles chart

$ASTS Monthly candles chart so far, the price needs to reclaim the 36-39 range before we can even consider another leg upward. About the recent news, I'm not an investor, so don't blame me for I'm not being thrilled about the plan of such high expenditure + challenging time.

$COIN Monthly chart so far. After that long term support breakdown ... the price is getting close to its 50% fibo retracement. 🧐

4
917
$OKLO 2-week hammer candle completed. Needs confirmation in the next couple of weeks. Stochastic could help this time ... or not ... what do I know of this f. market ... 2-week candles chart

22
2,459
$NVAX 2-week candle completed. Well ... you can see how it went after the bearish signal of its 2-week stochastic. Now the price is about to face its 2-week SMA50 (red dotted line) and two trend-based support levels. GLTA

$NVAX 2-week candles chart updated. Current 2-week period ends on Friday next week. Added that new Downtrend Line. The bearish signal on 2-week stochastic was triggered and FWIW I'm sharing the backtesting about that signal. GLTA

5
770
$BTC.X 2-week candles chart. Current candle ends this weekend. I hope we see some kind of "Crazy Ivan" move because I'm not a fan of this setup, not a fan at all. 🧐

1
3
443


$URA The nuclear winter is coming to an end? At the very least this deserves a good bounce, don't you think? . Early activation of the bullish crossover, keep that signal alive until EOW! 🙏 I'm adding the backtesting of the weekly stochastic

$QQQ 2-day candles chart and backtesting of stochastic after entering into oversold territory.🧐


$ASPI 2-week candles chart. Current 2-week candle ends next Frinday. I wouldn't care if we have a flat week because that candle and the stochastic setup are promising. 🙏

$ASPI Nice hammer/dragonfly candle. We need confirmation in the next week(s) and I'm looking for a higher low of some kind.
Fiinal bottom? 🙏
Weekly chart

1
4
920
$CAMT Monthly chart so far ... testing long term channel support + monthly SMA50 ( + weekly SMA200 ) ... interesting ...

5
558
$NVDA Weekly chart. You were a bad boy, Jensen ... LOL Let's see how it goes this week.
