

Global residential real estate data and market insights for investors.
Joined October 2009
- Tweets1.5K
- Following36
- Followers24.8K
- Likes1.7K






Eurozone rents rose 4.2% on average over the past year.
Q2 2025 to Q2 2026, rent price changes:
🇸🇮 Slovenia +9.6%
🇧🇬 Bulgaria +9.5%
🇬🇷 Greece +6.5%
🇱🇹 Lithuania +5.5%
🇸🇰 Slovakia +5.4%
🇳🇱 Netherlands +5.2%
🇵🇹 Portugal +5.1%
🇦🇹 Austria +4.8%
🇮🇪 Ireland +4.7%
🇱🇻 Latvia +4.4%
🇨🇾 Cyprus +4.2%
🇮🇹 Italy +3.6%
🇲🇹 Malta +3.5%
🇧🇪 Belgium +3.4%
🇪🇸 Spain +2.4%
🇩🇪 Germany +2.1%
🇪🇪 Estonia +2.0%
🇫🇷 France +1.6%
🇱🇺 Luxembourg +1.3%
🇫🇮 Finland +0.03%
Four things stand out:
1) Bulgaria adopted the euro in January 2026 and immediately posts the second fastest rent growth in the bloc.
2) Western Europe is cooling. Germany +2.1%, France +1.6%, Luxembourg +1.3%, Finland flat.
3) 17 of 20 markets are still above the ECB’s 2% target, but the largest economies are the ones closest to it.
4) Finland +0.03% is the outlier. A decade of heavy apartment construction in Helsinki has caught up with demand, and rents have stopped moving.

€1,000/month rents you a shared room in London and a 3-bedroom in Zagreb.
Median asking rents:
1-bed:
🇬🇧 London €3,460
🇳🇱 Amsterdam €2,275
🇫🇷 Paris €1,800
🇩🇪 Berlin €1,300
🇨🇿 Prague €985
🇵🇱 Warsaw €810
2-bed:
🇱🇹 Vilnius €1,000
🇷🇴 Bucharest €1,000
🇪🇪 Tallinn €950
🇵🇱 Kraków €900
🇬🇷 Athens €880
🇧🇬 Sofia €700
3-bed:
🇭🇷 Zagreb €1,000
🇫🇷 Toulouse €990
🇮🇹 Palermo €900
🇬🇷 Thessaloniki €850
🇧🇦 Sarajevo €615

€100,000 buys you a parking space in Zurich and a two-bedroom flat in Bucharest.
🇨🇭 Zurich 5 m²
🇫🇷 Paris 10 m²
🇬🇧 London 13 m²
🇩🇪 Berlin 19 m²
🇵🇱 Warsaw 24 m²
🇪🇪 Tallinn 32 m²
🇬🇷 Athens 40 m²
🇷🇴 Bucharest 43 m²
🇮🇹 Catania 75 m²
Same money, same continent

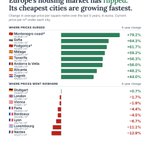
Europe’s housing market has flipped.
3-year change, €/m²:
🇱🇺Luxembourg −11%
🇫🇷Paris −4%
🇬🇧London −2%
🇦🇹Vienna −2%
🇲🇪Montenegro coast +79%
🇧🇬Sofia +64%
🇪🇸Málaga +59%
🇪🇸Alicante +48%
🇭🇷Zagreb +44%
While the "old" European market has flatten, more affordable cities are growing fast.

House prices have surged across Europe. But did homeowners actually get richer?
Over the past five years, residential property prices have increased dramatically in several eurozone countries.
However, once we adjust for inflation, the picture looks very different.
Here are some interesting examples (nominal growth vs inflation-adjusted growth):
🇱🇹 Lithuania: +80.4% vs +22.5%
🇪🇪 Estonia: +57.8% vs +5.8%
🇱🇻 Latvia: +50.5% vs +6.9%
🇸🇰 Slovakia: +47.7% vs +5.9%
🇳🇱 Netherlands: +21.7% vs −3.2%
🇧🇪 Belgium: +21.8% vs −1.3%
🇩🇪 Germany: +4.7% vs −13.9%
🇫🇷 France: +1.8% vs −11.3%
Meanwhile, some markets have delivered substantial real house price appreciation:
🇵🇹 Portugal: +48.6%
🇭🇷 Croatia: +36.7%
🇧🇬 Bulgaria: +30.9%
🇬🇷 Greece: +28.6%
In other words, a 50% increase in property prices doesn't necessarily mean homeowners have become 50% wealthier.
In several European markets, much of the nominal appreciation has simply reflected inflation.
And in some countries, homeowners have actually lost purchasing power despite rising property prices.
Which European housing market do you think will deliver the strongest inflation-adjusted returns over the next five years?
Source: Global Property Guide, five-year nominal and inflation-adjusted House Price Index changes, using local CPI.

🇲🇪 Montenegro's rent index just fell for the first time in four years.
Rents are up ~80% since 2022 (15% y-o-y). That run has now stopped.
What happens next? A couple of quarters or years of flat rents? A decline? Or another growth cycle?
What do you think?

5
1,560
Countries where you can still buy an apartment under $2,000/m²:
🇹🇷 Turkey
🇮🇳 India
🇧🇷 Brazil
🇲🇦 Morocco
🇵🇰 Pakistan
🇿🇦 South Africa
🇸🇦 Saudi Arabia
🇮🇹 Italy
🇰🇿 Kazakhstan
🇦🇷 Argentina
🇦🇿 Azerbaijan
🇬🇪 Georgia
🇲🇳 Mongolia
🇸🇰 Slovakia
🇱🇰 Sri Lanka
🇹🇳 Tunisia
🇺🇿 Uzbekistan

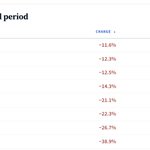
Where rental yields have fallen over the past three years (based on median asking prices and rents):
🇪🇪Estonia -11.4%
🇧🇬Bulgaria −12.0%
🇨🇿Czechia −12.5%
🇸🇬Singapore −14.3%
🇱🇹Lithuania −21.1%
🇵🇹Portugal −22.3%
🇶🇦Qatar −26.7%
🇬🇪Georgia −38.9%

🇪🇪 Estonia −11.6%: rents came off their 2022–23 spike and flattened while prices held, so a mild squeeze.
🇧🇬 Bulgaria −12.0%: prices up ~15% a year, rents up but slower.
🇨🇿 Czechia −12.5%: prices rebounded hard in 2024–25; rents grew half as fast.
🇸🇬 Singapore −14.3%: prices kept climbing while rents fell back from their 2023 peak.
🇱🇹 Lithuania −21.1%: steady price growth, rents barely moved after inflation cooled.
🇵🇹 Portugal −22.3%: prices up ~17% last year alone; rent growth capped by affordability and rent rules.
🇶🇦 Qatar −26.7%: prices flat, rents fell as post-World Cup supply hit the market.
🇬🇪 Georgia −38.9%: the 2022–23 migration wave pushed rents up first; rents then fell as arrivals left while prices stayed high.
Full comparison: globalpropertyguide.com/rent…

2
1,066
Residential Property Price Change: Q2 2026 vs Q1 2026
🇲🇹 Malta: +6.85%
🇦🇩 Andorra: +5.98%
🇲🇰 North Macedonia: +5.50%
🇸🇪 Sweden: +5.42%
🇹🇷 Turkey: +5.38%
🇲🇪 Montenegro: +4.58%
🇶🇦 Qatar: +3.37%
🇸🇦 Saudi Arabia: +2.95%
🇭🇰 Hong Kong: +2.93%
🇳🇴 Norway: +2.87%

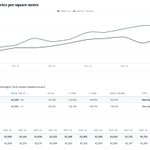
Average new-build property prices in coastal 🇲🇪Montenegro rose from €1,585 per sq. m. in Q3 2023 to €2,838 per sq. m. in Q2 2026.
That is an increase of 79.1% within 3 years.

Portugal and Croatia’s property markets have followed almost identical paths since Q1 2019.
Everyone talked about Portugal, but hardly anyone mentioned Croatia, even though the results were pretty much the same.
If you bought an average property in either country in Q1 2019, its value has likely doubled.

A pattern in European house prices worth paying attention to.
Between 2000 and 2007, residential prices doubled in several major markets within a remarkably short period:
🇩🇰Denmark: 5 years (2000 Q4 to 2006 Q1)
🇪🇸Spain: 6 years (2001 Q4 to 2007 Q4)
🇬🇧UK: 6.5 years (2001 Q1 to 2007 Q3)
🇫🇷France: 6.5 years (2000 Q4 to 2007 Q2)
Since 2019, a comparable pace has returned, though in a different set of markets.
🇵🇹Portugal and 🇭🇷Croatia both doubled over the same 6.5-year window (Q3 2019 to Q1 2026), following an almost identical trajectory.
In the new-build segment, the doubling was even faster for the following countries/cities.
🇧🇦Bosnia & Herzegovina: 4.8 years (21 Q2 to 26 Q1)
🇲🇪Montenegro: 5 years (21 Q1 to 26 Q1)
🇲🇰Skopje: 5 years (21 Q1 to 26 Q1)
🇲🇩Chisinau: 5.3 years (20 Q4 to 26 Q1)
It’s a useful reminder: the markets attracting the most attention aren’t always the ones producing the most interesting results.
Which market do you expect to be the next to double within seven years or less?

ALT How many years it took for house prices index to double.
5-Year Rent Price Change in Europe (Nominal, Local Currency):
🇲🇩Moldova +110.7%
🇲🇪Montenegro +83.4%
🇷🇸Serbia +71.2%
🇸🇮Slovenia +65.4%
🇭🇺Hungary +61.2%
🇱🇹Lithuania +46.6%
🇵🇱Poland +45.5%
🇨🇿Czechia +44.1%
🇷🇴Romania 41.6%
🇧🇬Bulgaria +41.3%
🇮🇪Ireland +31.7%
Sources: OECD, ECB, ES.

Average interest rates on new residential mortgage loans in Europe, Q1/Q2 2026:
🇺🇦Ukraine: 9.40%
🇮🇸Iceland: 9.12%
🇲🇩Moldova: 7.92%
🇭🇺Hungary: 7.81%
🇷🇴Romania: 6.13%
🇵🇱Poland: 5.70%
🇳🇴Norway: 5.34%
🇬🇧United Kingdom: 5.18%
🇲🇪Montenegro: 4.88%
🇷🇸Serbia: 4.74%
🇨🇿Czechia: 4.65%

We have just updated our average square meter prices for Asia-Pacific cities.
Here's how they compare (USD per m²) in Q2 2026:
🇭🇰 Hong Kong: $23,255
🇸🇬 Singapore: $17,715
🇰🇷 Seoul: $11,416
🇲🇴 Macau: $8,346
🇹🇼 Taipei: $7,817
🇯🇵 Tokyo: $5,305
🇹🇭 Bangkok: $3,651
🇨🇳 Beijing: $3,460
🇵🇭 Manila: $3,359
🇰🇭 Phnom Penh: $2,810
🇲🇾 Kuala Lumpur: $2,628
🇻🇳 Hanoi: $2,360
🇮🇩 Jakarta: $2,009
🇰🇿 Astana: $1,240
Some notable year-on-year changes:
🇻🇳 Hanoi: +21.0%
🇰🇿 Astana: +11.2%
🇲🇾 Kuala Lumpur: +10.3%
🇭🇰 Hong Kong: +10.0%
🇮🇩 Jakarta: −6.1%
🇹🇼 Taipei: −5.9%
🇵🇭 Manila: −5.5%
🇨🇳 Beijing: −13.1%
The full Q2 2026 dataset includes 250+ cities worldwide, with historical time series and quarterly updates, available on the Global Property Guide website.

Residential gross rental yields across Asia-Pacific range from 2% to 10%, depending on the country.
NET rental yields are typically ~30% lower once you account for property management, maintenance, insurance, accounting, vacancies, and other operating costs.
Our latest data shows the average gross rental yields by country:
🇰🇿 Kazakhstan: 10.95%
🇰🇭 Cambodia: 7.81%
🇬🇪 Georgia: 7.42%
🇮🇩 Indonesia: 7.15%
🇹🇭 Thailand: 6.49%
🇲🇾 Malaysia: 5.27%
🇮🇳 India: 5.16%
🇵🇭 Philippines: 5.10%
🇦🇺 Australia: 4.69%
🇯🇵 Japan: 4.55%
🇰🇷 South Korea: 4.31%
🇳🇿 New Zealand: 4.12%
🇻🇳 Vietnam: 3.85%
🇭🇰 Hong Kong: 3.55%
🇸🇬 Singapore: 3.06%
🇨🇳 China: 2.63%
🇹🇼 Taiwan: 2.26%
🇲🇴 Macau: 2.08%
Which Asia-Pacific property market surprises you the most?
How many countries do you currently own property in?
26%Non yet (researching)
39%1
33%2-4
2%5+
57 votes • Final results 1
1,680
We’ve just updated our quarterly square metre prices for 250+ cities around the world.
Here’s how prices per square metre have changed across 🇪🇺 Eurozone cities:
Fastest-growing markets:
🇧🇬 Sofia: +32.7% (€2,680/m²)
🇨🇾 Nicosia: +18.8% (€2,555/m²)
🇭🇷 Zagreb: +15.6% (€3,939/m²)
🇳🇱 Amsterdam: +13.0% (€9,437/m²)
🇱🇹 Vilnius: +11.4% (€3,059/m²)
🇸🇰 Bratislava: +10.3% (€3,845/m²)
Solid growth:
🇸🇮 Ljubljana: +8.4% (€4,500/m²)
🇵🇹 Lisbon: +7.2% (€6,113/m²)
🇪🇸 Madrid: +7.1% (€5,945/m²)
🇬🇷 Athens: +4.2% (€2,500/m²)
🇪🇪 Tallinn: +3.4% (€3,103/m²)
🇦🇹 Vienna: +3.4% (€7,965/m²)
🇮🇪 Dublin: +3.1% (€8,266/m²)
Stable or declining:
🇮🇹 Milan: +2.9% (€5,668/m²)
🇱🇻 Riga: +2.1% (€2,652/m²)
🇧🇪 Brussels: +1.2% (€3,522/m²)
🇩🇪 Berlin: +0.8% (€5,428/m²)
🇫🇷 Paris: −0.3% (€9,490/m²)
🇫🇮 Helsinki: −3.3% (€4,808/m²)
The full historical dataset covers 250+ cities across Europe, Asia-Pacific, the Middle East, and Latin America.
Square meter/foot prices in 🇨🇴Colombia have risen sharply for USD buyers.
Prices in cities such as Medellín and Bogotá are up by more than 30% in USD terms over the past 12 months.
A major reason? The Colombian peso has appreciated by more than 30% against the US dollar, significantly increasing prices when converted into USD.


2
1,639