

Quantitative market research / Data-driven Analysis. Historical stats support a thesis - they don’t replace one. Not investment advice. DYOR.
Germany
Joined May 2024
- Tweets695
- Following86
- Followers1.8K
- Likes998


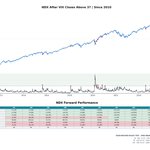


The VIX has now closed at 35.9. Since 2010, after VIX closes above 35.9, the Nasdaq-100’s median returns were +11.8% after 3 months, +22.6% after 6 months, +27.0% after 9 months and +31.4% after 12 months.
24 historical signals, with overlapping periods.


What happens after the VIX closes above 37?
Since 2010, the Nasdaq-100 was higher 3, 6, 9 and 12 months later in all 19 cases.
Average returns:
• 3M: +12.1%
• 6M: +24.8%
• 12M: +33.7%
First close above 37 per episode. Small sample, overlapping periods, not a guarantee.
(NDX and SPX 2000 and 2010 in comments)

What happens after the VIX closes above 37?
Since 2010, the Nasdaq-100 was higher 3, 6, 9 and 12 months later in all 19 cases.
Average returns:
• 3M: +12.1%
• 6M: +24.8%
• 12M: +33.7%
First close above 37 per episode. Small sample, overlapping periods, not a guarantee.
(NDX and SPX 2000 and 2010 in comments)


HB Research retweeted
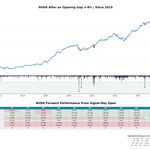
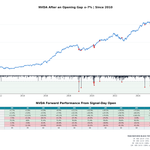
Wow, $NVDA is down 8.2% premarket.
Since 2010, opening gaps of −7% or worse have been followed by strong 6–12 month median returns and solid win rates (n=14 completed cases).
8% and 9% version in the comments, smaller sample.

Wow, $NVDA is down 8.2% premarket.
Since 2010, opening gaps of −7% or worse have been followed by strong 6–12 month median returns and solid win rates (n=14 completed cases).
8% and 9% version in the comments, smaller sample.


HB Research retweeted
VXN is about 30% below its prior 5-day high. NDX recently saw a ≥10% drawdown and is now trading above its 200-day moving average (rare setup).
Historically, similar setups have been bullish over the next six months, though the sample is small (11 cases).

Nvidia just posted its biggest 5-day drop since the 2022 bear market, down 18.3%.
25-day ROC in comments.


VXN is about 30% below its prior 5-day high. NDX recently saw a ≥10% drawdown and is now trading above its 200-day moving average (rare setup).
Historically, similar setups have been bullish over the next six months, though the sample is small (11 cases).
VIX a bit different : teapawt.org/HBResearchX/status/211…
The VIX is currently down about 22%. What happened to the Nasdaq-100 the other times the VIX fell 20% or more in a day?
Since 2010, the NDX was higher a month later in 13 of 14 completed cases. Six, nine and twelve months later, it was up every time.
Small sample, and today isn’t over yet.

2
276
A sharp spike in volatility is often a strong sign of market capitulation, in my opinion.

HB Research retweeted
The VIX is currently down about 22%. What happened to the Nasdaq-100 the other times the VIX fell 20% or more in a day?
Since 2010, the NDX was higher a month later in 13 of 14 completed cases. Six, nine and twelve months later, it was up every time.
Small sample, and today isn’t over yet.
The VIX is currently down about 22%. What happened to the Nasdaq-100 the other times the VIX fell 20% or more in a day?
Since 2010, the NDX was higher a month later in 13 of 14 completed cases. Six, nine and twelve months later, it was up every time.
Small sample, and today isn’t over yet.
Spike before: teapawt.org/HBResearchX/status/211…
VIX spiked >69% intraday vs. yesterday’s close, only the 6th time since 2004. The last three: Dec ’24’s Fed selloff, Aug ’24’s yen carry unwind, and 2018’s Volmageddon.

2
507
Gasoline futures just had their steepest weekly drop since the COVID crash (the one that eventually sent oil below zero).
Only the 10th weekly drop of 12% or more since 2006.

1
7
677

RSP/SPY rose 7.36% over 30 sessions as of Nov 6—a sign of strength beyond the largest stocks.
After past ≥4% readings, NDX was higher 3 months from the next-session close in 11/11 non-overlapping cases (avg +11.2%).

HB Research retweeted
Pretty solid: On the 12 previous days when the QQQ/LQD RSI(14) was at or below 25.5, QQQ was higher one week later in 11 cases (92%). It was higher after both 9 and 12 months in all 12 cases.
Small sample, with some overlapping observations.
LQD is the "iShares iBoxx $ Investment Grade Corporate Bond ETF"


Not even during the pandemic did this ratio reach such extreme levels.
This suggests potential short-term relief and a positive bias for the month ahead.
This setup has occurred only 12 times since August 2002 (unfortunately, LQD wasn't listed during most of the dot-com bear market).
The average 1-month return was +5.08% for QQQ, with positive returns in 9 out of 12 occurrences.
