

Talent Acquisition Specialist | George Mason MPS Alum | Virginia Tech Alum | 24
Joined October 2020
- Tweets6.1K
- Following516
- Followers1.2K
- Likes8.3K





Tyran Stokes is the best playmaking prospect in the draft at 6’8. That’s the ultimate separator that’ll make it difficult for other prospects to catch up.
Rotational Player on a Playoff Team from Day 1 Despite Being a Second Round Pick

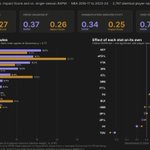
Here are the results when you place 7 of the main advanced stats against an NBA player’s 5-year RAPM.
Regularized Adjusted Plus Minus basically shows you how much a player affects Net Rating and On/Off after controlling for teammates.
A better percentage variation explained, partly due to RAPM being more reliable as a variable on a YoY basis.

This model shows which stats matter the most to an NBA player being a Net Positive on the basketball court.
The model explains a little more than a quarter (26%) of the variance in Impact Score over the last 10 completed seasons. It’s valuable nonetheless for traditionally noisy variables like On/Off and Net Rating at the individual level.
The 6 largest drivers in the model are: eFG%, STL, AST, FTA, 2P%, and TOV.
This suggests that shooting efficiently, and generating a lot of assists and steals, relative to how often you turn the ball over yourself, is associated with greater Impact Scores.
Amarri Monroe is one of the most underrated NBA prospects in the country despite being an older prospect.
All-time D1 steals leader for Quinnipiac at 6’7 220lbs, and led Quinnipiac and rebounds all 3 seasons. Also made 136 threes in 4 years, indicating comfortability from the 3 point line.
Best wing defender in the country with a respectable jumper. I think he’ll find an NBA role quite easily.
Around a quarter of a player’s Net Rating and On-Off values can be explained by just just 4 variables:
True Shooting %
A/TO
STL/TO
Total Rebounding %
Pretty significant foundation for traditionally noisy variables. Of course, other factors like teammates and system play a role.
This is a dataset of 531 players since the 2019-2020 season. I performed an elastic net regression to prevent model overfitting and cross-validated the model to get a 27% R^2 average.
I’m planning to add more variables to see if this increases prediction accuracy, but this is a solid start.

I ran a logistic regression on 986 draftees' last college season since 2005 to see what predicts whether or not they’ll ever become an All-Star.
It found weak signals in a couple of stats (AST/100, 2P%), but never tested draft position, and couldn't identify a single actual All-Star in its own test set.
I, therefore, evaluated draft position separately, and this is the most practical takeaway by far, though it may not be the most exciting. There is a significant exponential decay between draft selection and All Star Odds.
There’s decay among class as well, but that’s simply because freshmen typically get selected before everybody else. Once you control for selection, the class effect significantly reduces.
The main caveat is that All-Star status isn’t necessarily the best proxy for NBA success. I’m trying to find the best target variable that measures performance and controls for role.

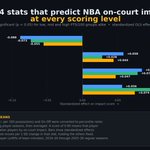
I ran predictive models for on-court impact among 1081 NBA player-seasons since 2019-2020. It’s moderated by PTS per 100
The target variable was a percentile-rank composite of OnCourt +/- and On-Off.
4 stats are significant in every usage tier: TOVs, STLs, ASTs, and eFG%.

FG% is the most interesting result here to me. The only efficiency stat with healthy reliability on a YoY basis.
My theory is that FGAs have a greater sample than 2PAs/3PAs separately which leads to more stabilized variance.
Meaningful takeaway regarding player evaluation
I performed an ICC analysis that evaluates which NBA stats (per 100) are the most consistent on a YoY basis.
7 seasons of data with 1219 player seasons
A major takeaway is the reliability of rebounding/positional stats vs the unreliability of efficiency.

If Bruce Branch can add 15-20lbs to his frame, it’ll be very difficult to keep him off an NBA floor for 15+ years.
7’3 wingspan with a comfortable 3 ball
He has all of the tools to avoid being a weak link on either side of the floor, and that usually leads to a long career.
Despite only playing 18 MPG with a 21% usage in the 2024 FIBA 17u World Cup, Tyran Stokes was still:
- 1st in the team in BPG
- 2nd in RPG
- 3rd in APG
Scales seamlessly between a connector and primary option. Best talent in the class and also the most portable
Jordan Smith is a defensive phenom.
He’s going to be one of the rare instances of a guard that earns, both, an All-Defense and an All-Star selection in the peak of his career.
3.2 SPG this season at Paul VI. Was top 10 in blocks and steals in the Peach Jam as a guard
Jordan Smith is a defensive juggernaut, and it’s one of the reasons why he has the best high school resume from 2026.
- Top 10 nationally in blocks & steals at Peach Jam
- 6.3 RPG & 3 SPG this season at Paul VI
- 6’2 205lb frame
Potential All-Star and All-Defensive Player

This chart examines players who:
1) Are assigned to the toughest matchups defensively, with limited offensive usage
2) Carry significant offensive load, with limited defensive matchup difficulty
3) Who are assigned with both. True two-way involvement
Min. 65 games played

Zyon Pullin beginning to make a big name for himself.
25 PPG on 57/53/81 splits this season in the G League
Looking like a Summer League MVP candidate at the moment
It was only a matter of time. Truly elite ball handlers adapt anywhere and fast.
Among players who played at least 65 games this season, there were 5 players who were in the 79th+ percentile in both Defensive Matchup Difficulty and Offensive Load.
Useful way to identify true two-way involvement when players are on the floor

70% of Bruce Thornton’s FG’s this past season were unassisted. He still posted a 67 TS%.
Just had 27 with a +20 +/- in his first SL.
Early, but these two stats seem to be a gold mine in predicting how comfortable a player will be on a basketball court at all times.
As I said before, Dybantsa will be a PG in the NBA.
74% of his FGs at BYU were unassisted.
For reference (This NBA Season)
SGA: 79.4%
Luka: 72.8%
Cade: 68.4%
6’10 A+ athlete who thrives in isolation & P&R. He’s going to be one of best playmakers in the world in 5 years
