

Your #1 source for income ETF news, data, and distribution tracking | We track the ETFs that put money in your pocket every month
Joined April 2026
- Tweets1.7K
- Following183
- Followers4.4K
- Likes1.3K




Pinned Tweet
🚨 Set a reminder
The Income Show w/ Tapp Alpha goes live this Thursday at 1:30 PM Eastern on X Spaces.
Tap the link and hit "Set reminder" so you don't miss it 👇
xitter.cf/i/spaces/1kKzDPjkMlyJv

JUST IN: STRIVE'S NEW $SATS PREFERRED JUST STARTED TRADING ON NASDAQ
It pays a fixed 15.00% annualized dividend on a $100 stated amount, paid every business day.
The first payment is November 9, 2026, and it includes dividends accrued since the October 20 close.


JUST IN: REX JUST ANNOUNCED DISTRIBUTIONS
$ULTI REX IncomeMax Option Strategy ETF $0.0800 per share
Distribution rate is not total return.
xitter.cf/REXShares/status/21130…

Distribution News for REX IncomeMax™ Option Strategy ETF Holders!
Pay date: 10/23/2026
Amount: $0.0800
$ULTI
Prospectus: rexshares.com/wp-content/upl…
ULTI
Fund Info and Standardized Performance: rexshares.com/ulti/

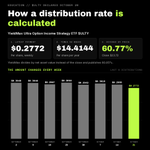
How a distribution rate is calculated.
YieldMax Ultra Option Income Strategy ETF $ULTY declared $0.2772 per share on October 20, 2026:
1. Latest payment: $0.2772 per share
2. Times 52 weekly payments: $14.4144 per share per year
3. Divided by the October 20, 2026 close of $23.72: 60.77% 🟢
YieldMax divides by net asset value instead of the close and publishes 60.85%. Monthly payers multiply by 12 instead of 52.
The rate assumes the latest payment repeats for a full year. The last 8 weekly $ULTY payments ranged from $0.2772 to $0.3058 per share.
Distribution rate is not total return.

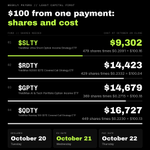
$100 from one weekly payment.
Shares needed for at least $100 from the distribution declared Tuesday, October 20 (ex-date today, payable Thursday, October 22), and what those shares cost at the October 20, 2026 close, least capital first:
🥇 YieldMax Ultra Short Option Income Strategy ETF $SLTY 479 shares · about $9,302 🟢
🥈 YieldMax R2000 0DTE Covered Call Strategy ETF $RDTY 429 shares · about $14,423 🟢
🥉 YieldMax AI & Tech Portfolio Option Income ETF $GPTY 369 shares · about $14,679 🟢
4. YieldMax Nasdaq 100 0DTE Covered Call Strategy ETF $QDTY 449 shares · about $16,727 🟢
Math: $100 divided by the amount per share, rounded up to whole shares. Amounts per share: $SLTY $0.2091, $RDTY $0.2332, $GPTY $0.2715, $QDTY $0.2230. One payment only. Amounts change every week.
Distribution rate is not total return.

NET WORTH BY AGE MATTERS!
Don’t shoot for the stars and expect 100% yielding positions to take you to the promise land.


$25,000 in each of these 4 YieldMax ETFs would pay you about $3,066 a month:
🥇 YieldMax Crypto Industry & Tech Portfolio Option Income ETF $LFGY
$852.50/month
🥈 YieldMax Memory and Storage Portfolio Option Income ETF $YRAM
$843.13/month
🥉 YieldMax Magnificent 7 Fund of Option Income ETF $YMAG
$740.63/month
4. YieldMax Strategic Metals & Mining Portfolio Option Income ETF $MINY
$629.58/month
Based on each fund's latest weekly distribution. Rates change every week and aren't the same as total return.

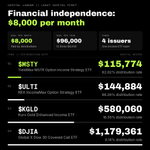
Financial independence goal: $8,000 per month.
That is $96,000 per year. Capital needed with one income ETF from each of 4 issuers at the latest published distribution rates, least capital first:
🥇 YieldMax MSTR Option Income Strategy ETF $MSTY 82.92% · about $115,774 🟢
🥈 REX IncomeMax Option Strategy ETF $ULTI 66.26% · about $144,884 🟢
🥉 Kurv Gold Enhanced Income ETF $KGLD 16.55% · about $580,060 🟢
4. Global X Dow 30 Covered Call ETF $DJIA 8.14% · about $1,179,361 🟢
Math: $96,000 divided by the distribution rate.
$MSTY and $ULTI as of October 14, 2026, each annualizing one weekly distribution. $KGLD as of September 30, 2026, annualizing one monthly distribution. $DJIA as of October 20, 2026.
Distribution rate is not total return.

Strive just announced distributions today
$SATA Strive Variable Rate Series A Perpetual Preferred Stock 13.00% dividend rate
Distribution rate is not total return.
xitter.cf/Strive/status/21128992…

"THESE FUNDS ARE SIMPLY JUST DOING FINANCIAL GYMNASTICS, HANDING YOU YOUR MONEY BACK."
That's the heat income ETF investors take on X. He gets it. He even agrees, to a degree.
"Personal investments are personal. I need the income anyway. I would be forced to sell."
If you need $600 for a car payment, the money is already coming into your account. No guessing the market. No selling on a bad day. That's the whole concept behind income ETF investing.

How My Portfolio Pays My Bills xitter.cf/i/broadcasts/1qGoNYvby…

TappAlpha just announced distributions today
$TDAQ TappAlpha Innovation 100 Growth & Daily Income ETF 17.59% distribution rate
Growth + Income


$TDAQ announces its October distribution ✔️
You’re already in the Nasdaq 100. Why not add a way to access its income potential...with TDAQ?
Stay tuned for more and get additional information here: tappalphafunds.com/etfs/tdaq.
Distribution Amount: $0.38252 per share
Distribution Rate (as of 10/20/26): 17.59%
30-day SEC Yield (as of 9/30/26): -0.22%
Ex-Date - Tuesday, 10/20/2026
Payable Date - Wednesday, 10/21/2026
The return of capital for this most recent distribution was estimated to be 98%. ROC reduces NAV and may be taxable as ordinary income or capital gain upon disposition or sale of Fund shares.
#Investing #CoveredCalls #CboeListed

REX just announced distributions today
$NVII REX NVDA Growth & Income ETF 36.88% distribution rate
$TSII REX TSLA Growth & Income ETF 50.77% distribution rate
$WMTI REX WMT Growth & Income ETF 17.77% distribution rate
Distribution rate is not total return.
xitter.cf/REXShares/status/21129…

Another Wednesday. Another payout.
Our Growth & Income Suite offers access to ETFs with the potential for income on a weekly distribution schedule.
Annualized Distribution Rates:
$NVII: 36.88%
30-Day SEC Yield: 2.60%
Return of Capital (ROC): 95.90%
$TSII: 50.77%
30-Day SEC Yield: 2.73%
Return of Capital (ROC): 96.70%
$WMTI: 17.77%
30-Day SEC Yield: 3.08%
Return of Capital (ROC): 91.90%
View each fund’s prospectus here:
NVII & TSII Prospectus: rexshares.com/wp-content/upl…
WMTI Prospectus: rexshares.com/wp-content/upl…
NVII Fund Info and Standardized Performance: rexshares.com/nvii/
TSII Fund Info and Standardized Performance: rexshares.com/tsii/
WMTI Fund Info and Standardized Performance: rexshares.com/wmti/
*As of 10/19/26. The Distribution Rate is the annual yield an investor would receive if the most recently declared distribution, which includes option income, remained the same going forward. The Distribution Rate is calculated by multiplying an ETF’s Distribution per Share by fifty-two (52), and dividing the resulting amount by the ETF’s most recent NAV. The Distribution Rate represents a single distribution from the ETF and does not represent its total return.
**As of 9/30/26. The 30-Day SEC Yield represents net investment income, which excludes option income, earned by such ETF over the 30-Day period, expressed as an annual percentage rate based on such ETF’s share price at the end of the 30-Day period.
NVII, TSII, & WMTI's current distributions consist of 100% estimated return of capital (ROC). For full details on the composition of distributions, please refer to the latest 19a-1 notices. The REX NVDA Growth & Income ETF has a gross expense ratio of 1.49%, the REX TSLA Growth & Income ETF has a gross expense ratio of 1.52%, and the REX WMT Growth & Income ETF has a gross expense ratio of 0.99%. There is no guarantee that the Funds will be successful in their attempt to provide leveraged exposure to the underlying stocks or pay weekly distributions.
The Funds are not suitable for all investors. These distribution rates caused by unusually favorable market conditions may not be sustainable. Such conditions may not continue to exist and there should be no expectation that this performance may be repeated in the future. The performance data quoted represents past performance. Past performance does not guarantee future results. The investment return their original cost and current performance may be lower or higher than the performance quoted. Performance current to the most recent month-end can be obtained by calling 1-844-802-4004. Short term performance, in particular, is not a good indication of the fund’s future performance, and an investment should not be made based solely on returns.

What would $500,000 in income ETFs pay you each month?
Split evenly, $125,000 in each of 4 Nasdaq-100 income ETFs, at their latest distribution rates:
🥇 $AIPI REX AI Equity Premium Income ETF: ~$3,624/month (34.79% rate)
🥈 $QQQT Defiance Nasdaq 100 Income Target ETF: ~$2,083/month (20.00% rate)
🥉 $KQQQ Kurv Technology Titans Select ETF: ~$1,508/month (14.48% rate)
4. $QYLG Global X Nasdaq 100 Covered Call & Growth ETF: ~$703/month (6.75% rate)
Total: ~$7,919 a month 🟢
Distribution rates change often and aren't the same as total return. Funds with very high rates can lose value even while paying out.

🚨 YieldMax announced distributions for some of their ETFs
Here are the YieldMax ETFs paying the most per share this week:
🥇 $MRNY YieldMax MRNA Option Income Strategy ETF $0.8851
🥈 $INYY YieldMax INTC Option Income Strategy ETF $0.3549
🥉 $GMEY YieldMax GME Option Income Strategy ETF $0.3418
4. $AMDY YieldMax AMD Option Income Strategy ETF $0.3387
5. $YSPC YieldMax SPCX Option Income Strategy ETF $0.2953
6. $HOOY YieldMax HOOD Option Income Strategy ETF $0.2583
7. $PLTY YieldMax PLTR Option Income Strategy ETF $0.2554
8. $FIAT YieldMax Short COIN Option Income Strategy ETF $0.2203
9. $WNTR YieldMax Short MSTR Option Income Strategy ETF $0.2063
10. $CONY YieldMax COIN Option Income Strategy ETF $0.1931
xitter.cf/YieldMaxETFs/status/21…


3 Russell 2000 income ETFs beat the iShares Russell 2000 ETF $IWM over 6 months.
Total return, April 20, 2026 close to October 20, 2026 close, distributions reinvested, highest first:
🥇 Global X Russell 2000 Covered Call ETF $RYLD 5.25% 🟢
🥈 YieldMax R2000 0DTE Covered Call Strategy ETF $RDTY 4.16% 🟢
🥉 Roundhill Russell 2000 0DTE Covered Call Strategy ETF $RDTE 2.24% 🟢
$IWM: -0.07%
Share prices over the same 6 months: $RYLD -0.85%, $RDTY -12.46%, $RDTE -12.79%. $RYLD paid 6 monthly distributions. $RDTY and $RDTE paid 26 weekly distributions each.
Over 3 months all 3 also finished ahead of $IWM: $RYLD -2.05%, $RDTY -3.55%, $RDTE -4.21%, $IWM -5.41%. Over 1 year only $RDTE was ahead, 12.48% versus 12.26%.
Distribution rate is not total return.

🚨 Roundhill 0DTE Covered Call weekly distributions
🟢 Roundhill S&P 500 0DTE Covered Call Strategy ETF $XDTE $0.111809 per share
🟢 Roundhill Nasdaq-100 0DTE Covered Call Strategy ETF $QDTE $0.113452 per share
🟢 Roundhill Russell 2000 0DTE Covered Call Strategy ETF $RDTE $0.100417 per share
🟢 Ex October 22, 2026
🟢 Pay October 23, 2026
Distribution rate is not total return.
xitter.cf/roundhill/status/21128…


🚨 EX-DATE TODAY: Wednesday, October 21
Shares bought today do not receive these distributions.
YieldMax weekly, payable Thursday, October 22, most cash per share first:
🥇 YieldMax Semiconductor Portfolio Option Income ETF $CHPY $0.4702 per share 🟢
🥈 YieldMax Ultra Option Income Strategy ETF $ULTY $0.2772 per share 🟢
🥉 YieldMax S&P 500 0DTE Covered Call Strategy ETF $SDTY $0.1811 per share 🟢
4. YieldMax Universe Fund of Option Income ETFs $YMAX $0.0563 per share 🟢
NEOS monthly, payable Friday, October 23:
NEOS Bitcoin High Income ETF $BTCI $0.6954 per share 🟢
NEOS Nasdaq-100 High Income ETF $QQQI $0.6343 per share 🟢
NEOS Russell 2000 High Income ETF $IWMI $0.5728 per share 🟢
NEOS S&P 500 High Income ETF $SPYI $0.5087 per share 🟢
REX weekly, payable October 22: REX AI Equity Premium Income ETF $AIPI, REX Crypto Equity Premium Income ETF $CEPI and REX FANG & Innovation Equity Premium Income ETF $FEPI. Amounts not yet posted.
Distribution rate is not total return.

Income ETF Cheat Sheet
5 terms every income investor should know:
1. Distribution Rate: The latest payment, scaled up to a yearly number. Not what you'll actually earn.
2. Total Return: Price change plus payments received. The real performance number.
3. NAV: What one share of the fund is actually worth.
4. Ex-Date: The cutoff day. Own the shares before this day to get paid.
5. Expense Ratio: The yearly fee. 0.68% means $6.80 per $1,000 invested.
Save this one 📌

🚨 REX Equity Premium Income weekly distributions
🟢 REX FANG & Innovation Equity Premium Income ETF $FEPI $0.2015 per share
🟢 REX AI Equity Premium Income ETF $AIPI $0.2396 per share
🟢 REX Crypto Equity Premium Income ETF $CEPI $0.2309 per share
🟢 Ex October 21, 2026
🟢 Pay October 22, 2026
Distribution rate is not total return.
xitter.cf/REXShares/status/21126…
Weekly Distribution News for FEPI, AIPI & CEPI Holders!
Payout Date: 10/22/26
Distribution for FEPI
Amount: $0.2015
Distribution for AIPI
Amount: $0.2396
Distribution for CEPI
Amount: $0.2309
FEPI Prospectus: rexshares.com/wp-content/upl…
FEPI Fund Info and Standardized Performance: rexshares.com/fepi/
AIPI Prospectus: rexshares.com/wp-content/upl…
AIPI Fund Info and Standardized Performance: rexshares.com/aipi/
CEPI Prospectus: rexshares.com/wp-content/upl…
CEPI Fund Info and Standardized Performance: rexshares.com/cepi/
