

Basketball | Cyclist | Runner | Trail | Analytics in Finance | Tableau : Social Ambassador '21-26 | Teaching in a University
Joined March 2009
- Tweets4.5K
- Following529
- Followers919
- Likes20.6K





Surprised and humbly honoured on my another #Vizoftheday from my challenge on #B2VB
Very happy to feel value of how i show the data.
Thanks #Tableau, you definitely have changed my life!

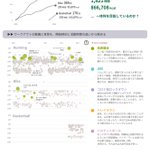
This #VizOfTheDay by @Issy1972 uses an isometric dot grid and botanical color palette to track seasonal flower blooming windows across the United States. Discover how bloom durations and plant heights unfold from spring through late autumn.
Explore the viz on Tableau Public: tabsoft.co/4zm6RbE

My #B2VB challenge W19 : use dynamic zone visibility
Tried showing peak months that last until 2015, maybe replaced by digital afterwards
DZV is for detail of each title when clicked
@tableaupublic URL
public.tableau.com/app/profi…
thx @ReadySetData @datavizfairy @VizWithVictory


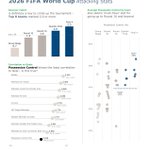
My #Makeovermonday challenge W38 : CFB roster spending
Tried showing relation b/w budget and top25 ranks - Top 10 are heavy-budgeted team, but some surprise observed below them
@tableaupublic URL
public.tableau.com/app/profi…
Thanks @DatavizChimdi

無事にTune up デモを終えることができました。
note にまとめたので、見逃してしまった方も、よくわからなかった!という方も自分のペースで挑戦してみてください。
理解できたところは、ぜひご自身の業務で実践してみて欲しいです!
note.com/yasushi_ishikawa/n/…


🔍このViz、どうやって作ったの?
Tableau tuneup すごいVizの裏側、のぞいてみた
~神ダッシュボード解剖会~
🤵♂️ドクターは@ex_tabtab_big さん、@lssy1972 さん!
お2人作成の神Vizを、ご本人が徹底解剖・解説します✨ 👇お申込 techplay.jp/event/1000288 #Tableau #JTUG

yasushi_ishikawa retweeted

Fresh vizzes, useful Tableau tips, and community highlights you won’t want to miss—all in the #DataFam Roundup: tabsoft.co/4rxe0CQ

yasushi_ishikawa retweeted

This #VizOfTheDay by @TIkeda93820944 brings U.S. seasonal flower blooms to life through a 3D radial ribbon design.
By mapping bloom duration around a 12-month circular dial and plant height vertically, this piece blends data visualization with botanical art.
Explore the viz on Tableau Public: tabsoft.co/4xCEXGs

My #B2VB @back2vizbasics challenge W18 : use annotations, w/US flower seasonal blossom
"Tilted" waffle chart, w/height of bloom
I wasn't able to pack all into a single sheet...
@tableaupublic URL
public.tableau.com/app/profi…
Thanks @ReadySetData @VizWithVictory @datavizfairy

yasushi_ishikawa retweeted

\ #VizSpace 2026秋 Virtual Gallery公開🎨/
会場で展示される作品はもちろん、ここでしか出会えない作品もご覧いただけます!
「Kawaii」をテーマに生まれた様々なVizを、ゆっくりお楽しみください✨
visit.virtualartgallery.com/…
#JTUG #Tableau

JP #vizgames qualifier viz
'My Wellness' - 9年間のワークアウトログから自分のウェルネスを考える
@tableaupublic URL
public.tableau.com/app/profi…
当初からのログが取れず、年齢とともに量も質も減ってるのが見えないですが、地道に続けているものが自分のIdentityの一部になってる気がします。


with humble honour, I appreciate for coming back to #tableauambassador 2026.
And congrats to all leaders here, let's enjoy exploring how we can expand the value of data in AI era!

Congratulations to the 2026 Tableau Community Leaders!
Ambassadors with the Tableau Community Leader designation contribute across the community. They evangelize Tableau, nurture growth, and amplify connection.
#TableauAmbassador

あまりにもAIに関する理解が浅いので、AIとどう向き合うかの基礎知識を身につけるべく、e-learningを教えてもらい挑戦しました。
東京大学 江間研究室 AI x Society
sites.google.com/g.ecc.u-tok…
気軽に読めるし、かなり勉強になりました。
実はAI良く分からず不安。。。という方にはオススメです!


yasushi_ishikawa retweeted

#オープンデータスゴイ
Round6 進化した目黒区施設データを可視化せよ!
締め切りは過ぎてしまいましたが、やっと完成。今回は、目黒区の防災備蓄倉庫を施設データから深掘りしてみました。今回もいろんな発見があって面白かった🤩
🔗public.tableau.com/app/profi…
#VIZZIES目黒区コラボ #Tableau


#オープンデータスゴイ
Round6 進化した目黒区施設データを可視化せよ!
#VIZZIES目黒区コラボ
本日8/31締切りとしていますが、発信を止める理由はありません。笑
引き続きみなさまの投稿をお待ちしています!
#オープンデータスゴイ rd6 #VIZZIES目黒区コラボ
取り組んでいる方ありがとうございます!
進化の一つ、データ構成リストのご紹介
これに沿ってデータをつなげたら、取込みから利用状況俯瞰まで10分でした!
フィールド名統一や、大区分、西暦も地味にありがたい
ぜひ #Tableau で触ってほしいです


yasushi_ishikawa retweeted

8月末の締切まで残り数日ですが作りました💪
私の子供も来年度より支援学校への進学を検討していることもあり、少し身近なテーマでデータを選ばせてもらいました。どこも増えているようですね(ちなみに学校の場合は区立ですね)。
何かの参考になれば!
public.tableau.com/views/_17… @tableaupublicより

#オープンデータスゴイ Round6
#VIZZIES目黒区コラボ:進化した目黒区施設データを可視化せよ
オープンデータ改善を続ける目黒区とコラボ第2弾
データ構成や項目が進化してます
可視化で何が見えるのか?データへのポジティブな気づきを募集!
締切は8月末。
さあ、可視化のチカラを証明しよう!

yasushi_ishikawa retweeted

📊データ活用の目的、自社だけでは勿体無い⁉️
「お客様向けデータ分析サービス」、実は近年増えてます⤴️😳
三井住友カード社、ロイヤリティマーケティング社をお招きし、こうした事業の裏側をご紹介します!
📅日時:9月30日15:00-16:30
✅お申込👇
salesforce.com/jp/events/web…

#オープンデータスゴイ rd6 #VIZZIES目黒区コラボ
取り組んでいる方ありがとうございます!
進化の一つ、データ構成リストのご紹介
これに沿ってデータをつなげたら、取込みから利用状況俯瞰まで10分でした!
フィールド名統一や、大区分、西暦も地味にありがたい
ぜひ #Tableau で触ってほしいです
#オープンデータスゴイ Round6
#VIZZIES目黒区コラボ:進化した目黒区施設データを可視化せよ
オープンデータ改善を続ける目黒区とコラボ第2弾
データ構成や項目が進化してます
可視化で何が見えるのか?データへのポジティブな気づきを募集!
締切は8月末。
さあ、可視化のチカラを証明しよう!
yasushi_ishikawa retweeted
This #VizOfTheDay by @yamacho1111 transforms custom polygon mapping into a feast for the eyes, meticulously assembling an intricate mosaic platter of meat sashimi.
Explore the viz on Tableau Public: tabsoft.co/4gxMLCX
