

South Africa in numbers. Official sources, the whole record, no opinions.
- Tweets77
- Following9
- Followers11
- Likes0





ALT Dark green card with the words: No DNA. Just RSA stats. RSA is in gold.

ALT Irregular spending. Irregular and wasteful spending as a share of all spending. Lower is better. The share each year, highest in 2024/25 first: Nelson Mandela Bay 13.7, 11.3, 9.8, 9.2, 11.3, 11.2. Buffalo City 3.9, 3.8, 71.3, 19.0, 12.9, 10.3. Tshwane 7.5, 8.0, 5.0, 12.6, 7.2, 7.7. Joburg 4.1, 3.9, no figure, 2.7, 5.8, 6.9. Mangaung no figure, 4.0, no figure, 5.5, 6.2, 3.9. Cape Town 1.7, 1.8, 0.1, 0.0, 1.2, 1.6. Ekurhuleni 0.4, 0.6, 0.7, 0.3, 0.2, 0.3. eThekwini 2.7, 1.9, 3.4, 5.1, 2.9, no figure. Source: Auditor-General, Audited statements.

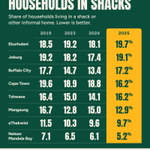
ALT Households in shacks. Share of households living in a shack or other informal home. Lower is better. The share in 2019, 2023, 2024, 2025, highest in 2025 first: Ekurhuleni 18.5, 19.2, 18.1, 19.7. Joburg 19.2, 18.2, 17.4, 19.1. Buffalo City 17.7, 14.7, 13.4, 17.2. Cape Town 19.6, 18.9, 18.8, 16.2. Tshwane 16.4, 15.0, 14.1, 16.2. Mangaung 16.7, 12.8, 15.0, 12.9. eThekwini 11.5, 10.3, 9.6, 9.7. Nelson Mandela Bay 7.1, 6.5, 6.1, 5.2. Source: Statistics South Africa, General Household Survey.

ALT Living on a wage. Share of households whose main income is a wage or salary, and beside it, those living mainly on grants. The share in 2019, 2022, 2023, 2024, 2025, highest in 2025 first: Cape Town 67.5, 65.4, 68.5, 68.5, 67.7; 13.8% on grants, 2025. Joburg 66.8, 62.9, 65.0, 62.7, 67.4; 10.9% on grants, 2025. Ekurhuleni 62.9, 64.0, 64.2, 66.8, 63.9; 13.0% on grants, 2025. Tshwane 63.9, 57.2, 63.7, 64.9, 60.3; 13.6% on grants, 2025. eThekwini 65.8, 61.3, 64.3, 65.1, 58.8; 17.5% on grants, 2025. Nelson Mandela Bay 54.6, 56.9, 59.0, 56.8, 52.3; 28.7% on grants, 2025. Buffalo City 54.4, 47.6, 56.9, 53.4, 50.1; 32.3% on grants, 2025. Mangaung 53.8, 45.3, 50.7, 45.9, 46.0; 29.5% on grants, 2025. Source: Statistics South Africa, General Household Survey.

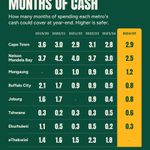
ALT Months of cash. How many months of spending each metro's cash could cover at year-end. Higher is safer. Months of cash at each year-end, highest in 2024/25 first: Cape Town 3.6, 3.0, 2.9, 3.1, 2.8, 2.9. Nelson Mandela Bay 3.7, 4.2, 4.0, 3.7, 3.0, 2.5. Mangaung no figure, 0.3, 1.0, 0.9, 0.6, 1.2. Buffalo City 2.1, 1.7, 0.9, 0.9, 0.9, 0.8. Joburg 1.6, 1.7, no figure, 0.9, 0.4, 0.8. Tshwane 0.3, 0.2, 0.3, 0.3, 0.5, 0.6. Ekurhuleni 1.1, 0.5, 0.3, 0.5, 0.2, 0.3. eThekwini 1.4, 1.6, 1.5, 2.3, 1.8, no figure. Source: Metros' audited statements, 2019/20 to 2024/25.

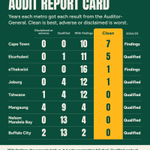
ALT Audit report card. Years each metro got each result from the Auditor-General. Clean is best, adverse or disclaimed is worst. Years with each opinion, most clean audits first, with the latest opinion: Cape Town 0, 0, 10, 7; Findings 2024/25. Ekurhuleni 0, 1, 11, 5; Qualified 2024/25. eThekwini 0, 0, 16, 1; Findings 2024/25. Joburg 0, 4, 12, 1; Qualified 2024/25. Tshwane 1, 4, 12, 0; Qualified 2024/25. Mangaung 4, 9, 4, 0; Qualified 2024/25. Nelson Mandela Bay 0, 13, 4, 0; Qualified 2024/25. Buffalo City 2, 13, 2, 0; Qualified 2024/25. Source: Auditor-General of South Africa, MFMA reports.

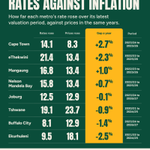
ALT Rates against inflation. How far each metro's rate rose over its latest valuation period, against prices in the same years. Rates rose, prices rose and the gap a year, biggest gap first, with the period: Cape Town 14.1, 8.3, +2.7; 2023/24 to 2025/26 period. eThekwini 21.4, 13.4, +2.3; 2022/23 to 2025/26 period. Mangaung 16.8, 13.4, +1.0; 2022/23 to 2025/26 period. Nelson Mandela Bay 15.8, 13.4, +0.7; 2022/23 to 2025/26 period. Joburg 12.5, 12.9, −0.1; 2023/24 to 2026/27 period. Tshwane 19.1, 23.7, −0.9; 2020/21 to 2024/25 period. Buffalo City 8.1, 12.9, −1.4; 2023/24 to 2026/27 period. Ekurhuleni 9.5, 18.1, −2.5; 2021/22 to 2024/25 period. Source: Metro tariff schedules, Stats SA CPI.

ALT Rates on a R1m home. What each metro charges a month in property rates on a home valued at R1 million. Value not rated, rate per rand and rates a month, highest first, with the mayor's party: Buffalo City R15k, 1.54c, R1 266; ANC mayor's party. Nelson Mandela Bay R15k, 1.40c, R1 147; ANC mayor's party. eThekwini R120k, 1.47c, R1 075; ANC mayor's party. Ekurhuleni R150k, 1.17c, R828; ANC mayor's party. Tshwane R250k, 1.23c, R769; ActionSA mayor's party. Mangaung R180k, 1.05c, R719; ANC mayor's party. Joburg R300k, 0.99c, R577; ANC mayor's party. Cape Town R620k, 0.70c, R222; DA mayor's party. Source: Metro tariff schedules, 2026/27.

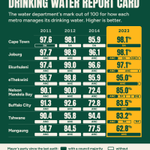
ALT Drinking water report card. The water department's mark out of 100 for how each metro manages its drinking water. Higher is better. Marks at the 2011, 2012, 2014 and 2023 audits, highest in 2023 first, with the mayor's parties in turn: Cape Town 97.6, 98.1, 95.9, 98.1; DA. Joburg 97.7, 98.9, 96.1, 98.1; ANC, DA, ANC, DA. Ekurhuleni 97.4, 99.0, 96.6, 97.1; ANC, DA. eThekwini 95.7, 98.8, 95.9, 95.0; ANC. Nelson Mandela Bay 90.1, 90.0, 72.4, 85.0; ANC, DA, UDM, AIC, DA, ANC. Buffalo City 91.3, 92.6, 72.8, 83.5; ANC. Tshwane 90.4, 95.8, 94.4, 83.2; ANC, DA, an administrator, DA. Mangaung 84.7, 84.5, 77.5, 62.8; ANC. Source: Department of Water and Sanitation, Blue Drop reports.

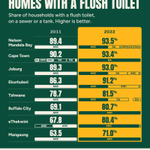
ALT Homes with a flush toilet. Share of households with a flush toilet, on a sewer or a tank. Higher is better. The share at the 2011 and 2022 censuses, highest in 2022 first, with the mayor's parties in turn: Nelson Mandela Bay 89.4, 93.5; ANC, DA, UDM, AIC, DA, ANC. Cape Town 90.2, 93.4; DA, ANC, DA, ACDP, DA. Joburg 89.3, 93.0; ANC, DA, ANC, DA. Ekurhuleni 86.3, 91.2; ANC, DA. Tshwane 78.7, 81.5; ANC, DA, an administrator, DA. Buffalo City 69.1, 80.7; ANC. eThekwini 67.8, 80.4; ANC. Mangaung 63.5, 71.0; ANC. Source: Statistics South Africa, Census 2011 and 2022.

ALT Weekly refuse removal. Share of households whose refuse is removed at least once a week. Higher is better. The share at the 2001, 2011 and 2022 censuses, highest in 2022 first, with the mayor's parties in turn: Cape Town 94.3, 94.3, 91.4; DA, ANC, DA, ACDP, DA. Joburg 90.9, 95.3, 91.4; ANC, DA, ANC, DA. Nelson Mandela Bay 86.1, 82.9, 89.5; ANC, DA, UDM, AIC, DA, ANC. Ekurhuleni 87.9, 88.4, 89.4; ANC, DA. Tshwane 75.2, 80.7, 81.8; ANC, DA, an administrator, DA. eThekwini 85.7, 85.6, 81.5; ANC. Buffalo City 71.2, 68.2, 72.5; ANC. Mangaung 60.0, 77.8, 59.9; ANC. Source: Statistics South Africa, Census 2001, 2011 and 2022.