

Crypto Intelligence Platform ETF-Flows · On-Chain · Makro · Marktanalyse Insights. Analyse. Intelligence.
Trofaiach, Österreich
Joined May 2026
- Tweets214
- Following92
- Followers165
- Likes146






Pinned Tweet
Krypto verstehen, nicht nur folgen.
Kryptopath entsteht als moderne Crypto Intelligence Plattform für ETF-Flows, On-Chain-Daten, Makro-Insights und Marktanalyse.
Nicht nur Daten. Sondern Kontext, Struktur und Verständnis.
Insights. Analyse. Intelligence.

Can historical market patterns actually predict Bitcoin's next move?
We tested this question using KryptoPath's historical market comparison engine.
Two models. Two different perspectives.
• Crypto-only similarities: +5.97% median BTC return over 30 days (10 independent episodes).
• Cross-market similarities, including macro conditions: −5.58% median BTC return over 30 days (8 independent episodes).
Same current market. Opposite historical outcomes.
The important finding isn't a price prediction.
It's that historical similarity alone does not establish predictive reliability — especially with small samples and changing market conditions.
Our broader historical validation also showed only a modest improvement over a baseline, insufficient to establish a reliable trading edge.
We're building KryptoPath around a simple principle:
Research should explain uncertainty, not hide it.

Wall Street has embraced Bitcoin.
So why is the market still struggling?
On October 22, US spot Bitcoin ETFs reportedly recorded approximately $635.5 million in net outflows.
Two days later, Bitcoin briefly fell below $80,000, accompanied by reports of roughly $436 million in leveraged crypto liquidations within four hours.
Two significant developments. But they don't necessarily tell the same story.
ETF flows measure capital moving into and out of investment products.
Liquidations reflect forced closures of leveraged positions.
Neither explains the entire market on its own.
And that's where I think crypto analysis often goes wrong.
We look for one number that explains everything.
One ETF headline.
One liquidation event.
One technical indicator.
But markets are rarely that simple.
Institutional adoption doesn't eliminate volatility. Strong ETF demand on one day doesn't guarantee higher prices the next. And a sharp sell-off doesn't automatically mean long-term conviction has disappeared.
To understand what's happening, we need to look deeper:
• ETF flows and their persistence
• Leverage and open interest
• Market liquidity
• Macroeconomic conditions
• On-chain activity
More importantly, we need to understand where these signals agree, where they contradict each other, and what remains uncertain.
That's the approach we're developing at KryptoPath.
Not another prediction machine.
A platform designed to help people understand the evidence behind market movements.
Because good analysis isn't about always being right.
It's about knowing what the data actually supports.
What do you think we're seeing right now: a temporary leverage shakeout or a more persistent shift in market demand?
Sources: The Block (October 23–24, 2026); ETF flow figures attributed to SoSoValue; liquidation figures attributed to CoinGlass.

Bitcoin can rise while the underlying market becomes weaker.
And Bitcoin can fall while some of the underlying conditions are actually improving.
That's what makes crypto analysis so interesting.
Price tells you what happened.
But what about liquidity?
ETF flows?
Derivatives positioning?
On-chain activity?
Macroeconomic pressure?
These signals don't always agree. And that's exactly why looking at them together matters.
A bullish chart doesn't automatically mean a healthy market. And a red day doesn't automatically mean the fundamentals have deteriorated.
The real challenge isn't finding an indicator that confirms what you already believe.
It's understanding what the data supports, what contradicts it, and what remains uncertain.
That's the kind of research we're developing at KryptoPath, together with ALBERT.
I'm curious:
Which market signal do you trust the most — and which one has disappointed you?
kryptopath.io

Most crypto platforms show you numbers.
But how many explain where those numbers come from, how they're calculated, and where their limitations begin?
At KryptoPath, we believe market analysis should be transparent, reproducible, and open to scrutiny.
That's why we publish our Market Score methodology, data sources, historical limitations, and calculation weights.
And with ALBERT, we're working to connect these insights into a more meaningful analytical experience.
No guaranteed predictions. No artificial certainty.
Just data, context, and a commitment to building something genuinely useful.
Explore the platform: kryptopath.io
What do you think crypto analytics platforms are still missing?
#Bitcoin #Crypto #KryptoPath

🚨 The Fed just became a much bigger story for Bitcoin.
US inflation has climbed to 3.7%, above the Fed's 2% target.
Following today's CPI report, markets repriced the probability of another rate hike on October 28 from roughly 22% to 45%.
Bitcoin is already feeling the pressure.
But here's what matters:
It's not just the interest rate decision.
Watch the US dollar, Treasury yields, liquidity and how expectations change.
At KryptoPath, we're tracking these relationships using historical Bitcoin data, macro indicators and market correlations.
One striking example: Bitcoin's correlation with 10-year Treasury yield changes is +0.57 over our latest 24 observations, compared with just +0.07 across the full historical sample.
That doesn't predict what happens next.
It shows why market relationships need to be analyzed in context.
The Fed meets October 27–28.
The question isn't simply whether rates rise. It's what the market has already priced in.
Explore the data:
kryptopath.io
No hype. Just data, context and understanding. ⚡

Most crypto platforms show you what the market is doing.
We’re trying to answer the harder question:
What does it actually mean?
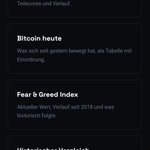
KryptoPath now brings together four daily views of the market:
→ Market Score — the state of the crypto market from 0–100, including underlying sub-scores
→ Bitcoin Today — what changed since yesterday and how to interpret it
→ Fear & Greed — today’s sentiment in historical context going back to 2018
→ Historical Comparison — finds previous market days that most closely resemble today
The goal isn’t to predict the future.
It’s to give today’s market context.
Current data.
Historical perspective.
Transparent methodology.
No hype. Just understanding.
kryptopath.io

Crypto Market Update — Oct 8, 2026
Bitcoin is down 2% to $81,750, Ethereum -4.2%,
Solana -5.9%. Total market cap lost $150B in 24h,
now sitting at $2.78T.
Fear & Greed: 64 — still "Greed", but cooling fast
from highs above 73 just days ago.
What's happening under the hood:
💧 Stablecoin liquidity dropped $10B in a single day
→ Capital is leaving the ecosystem, not rotating
📉 DeFi TVL down 4.3% in 24h
😴 A dormant Bitcoin wallet from 2010 moved millions
→ Markets don't like surprises from the past
🏛️ US government shifted $566M in crypto to Coinbase
→ Likely custody movement, not a sell-off
📊 Internal structure was already weak before the drop:
Trend Score: 14/100 — momentum without foundation
Macro adds no relief:
→ US 10Y yield: 5.28%
→ Inflation: 3.71% YoY
→ Fed rate: 3.88% — still restrictive
No single catalyst explains today's move.
The cracks were already there.

167 followers. 🧡
For some, that might just be a number.
For me, it means 167 people decided to follow the journey of KryptoPath.
Every follow, comment, piece of feedback and conversation helps us improve what we're building.
KryptoPath is still growing.
We're testing, learning, improving — step by step.
And seeing more people discover the platform and believe in what we're building genuinely means a lot.
Thank you to every single one of you. ⚡
We're just getting started.
— KryptoPath
Crypto sentiment is still greedy.
Our data tells a different story.
Today, the KryptoPath Market Score dropped to 45/100 — Neutral.
→ 10 points lower than yesterday
→ 12 points lower than 7 days ago
→ Market Trend: 14/100
→ Sentiment: 71/100
That divergence matters.
Sentiment remains strong, while the underlying market structure has weakened considerably.
But one day of data means little without context.
So we compared today's reading with 3,254 days of KryptoPath market history going back to November 2017.
Today's score sits around the 27th percentile of our historical dataset.
This is exactly why we're building KryptoPath.
Not to predict the next candle.
But to understand where the market stands now, how its components are changing, and how today's environment compares with history.
Price tells you what happened.
Context helps you understand why.
Context before emotion. ⚡
KryptoPath – Crypto Intelligence


Crypto doesn’t have a data problem.
It has a context problem.
Why is Bitcoin moving today?
Is the market actually strong — or does it just look that way?
Is funding getting overheated?
Is liquidity entering or leaving the market?
Are altcoins gaining strength — or is Bitcoin taking control?
What are on-chain signals telling us?
What is macro doing in the background?
Which news actually matters?
Have we seen a market environment like this before?
And what happened then?
These are the questions we want KryptoPath to help answer.
Market data.
On-chain.
Macro.
Sentiment.
Historical data.
News.
Connected in one place — with ALBERT helping make sense of it all.
Because having more data isn’t the goal.
Understanding the market is.
No hype. No certainty where there is none.
Just data, context and better questions.
KryptoPath.io

We’ve just expanded KryptoPath. ⚡
Not with more noise.
With more data, context and transparency.
Several new public tools are now live:
📊 Market Score
See the current state of the crypto market in one score — broken down into Momentum, Sentiment, Market Trend, Liquidity, On-Chain and Funding.
🧠 Historical Comparison
See how today’s market environment compares with similar periods in the past.
😨 Fear & Greed
Not just today’s number — explore the historical context behind market sentiment.
🔍 Methodology
See how our scores are calculated, which data we use, and where the limitations are.
📈 Crypto Market Analysis
A broader view of market conditions, liquidity, cycles and on-chain signals.
The goal is simple:
We don’t want to predict the next candle.
We want to make it easier to understand what is happening beneath it.
Live data.
Historical context.
Transparent methodology.
No hype. No price promises. Just understanding.
Everything is now live on KryptoPath.
👉 kryptopath.io
And if you test it: tell us what’s missing or what you would improve.
We’re building this for people who actually want to understand the market.

We need more people to really challenge ALBERT.
Not just click around KryptoPath.
Actually put it to the test.
Ask difficult questions.
Challenge its analysis.
Test conflicting signals.
Try to find weaknesses.
Tell us what’s missing.
ALBERT is built to connect:
Market Data + On-Chain + Macro + Sentiment + Historical Data
And right now, we’re working on making it even faster and integrating real-time news directly into its intelligence layer.
But we don’t want to build this in a bubble.
We want real users to push ALBERT to its limits.
If something is unclear — tell us.
If something is too slow — tell us.
If an analysis could be better — tell us.
And if you have an idea that would make KryptoPath genuinely more useful, we want to hear that too.
👉 Try KryptoPath and put ALBERT to the test:
kryptopath.io
Then come back and tell us:
What should ALBERT do better?
We’re listening.
KryptoPath is live — and now I want your honest feedback.
We’ve spent months building a platform that brings crypto market intelligence into one place.
Market data.
On-chain signals.
ETF flows.
Macro.
Sentiment.
Historical data.
Portfolio intelligence.
And ALBERT — our AI layer that connects the dots instead of just throwing more numbers at you.
But no platform becomes great by building behind closed doors.
So here’s an open invitation:
Visit KryptoPath.
Explore it.
Click around.
Try the tools.
Look at the data.
And if you find something that could be better — tell us.
A feature you’re missing?
Something that feels too complicated?
Data you’d like to see?
A completely new idea?
We genuinely want to hear it.
KryptoPath wasn’t built to be another crypto website.
The goal is to build a platform people can actually use to understand what is happening in the market — and why.
No hype.
No promises.
Just better information, better context and better decisions.
→ kryptopath.io
If you have 5 minutes, take a look.
And don’t be polite.
Tell us what you would improve.
Bitcoin just sent a signal the market shouldn't ignore.
BTC surged from below $76,000 to around $87,000 in a matter of days.
But this isn't just another crypto pump.
Look underneath the price:
→ ~$1 BILLION flowed into U.S. spot Bitcoin ETFs in a single day
→ The strongest daily ETF inflow in 11 months
→ Hundreds of millions in short positions were liquidated
→ Bitcoin reached its highest level in roughly 8 months
→ The broader crypto market moved higher with it
Now comes the important part.
A short squeeze can move price quickly.
But a short squeeze alone doesn't explain nearly $1 billion of fresh ETF demand.
That's why this move deserves attention.
There are two forces working together:
REAL DEMAND
Institutional capital is flowing back through spot ETFs.
FORCED DEMAND
Traders betting against the market are being forced to buy back their positions.
Put both together and you get exactly the kind of acceleration we're seeing now.
But there is another side to the story.
The macro environment is NOT clean.
U.S. Treasury yields remain elevated.
Inflation concerns haven't disappeared.
Monetary policy remains restrictive.
Oil and geopolitical risks are still in the background.
So the real question isn't:
“Is Bitcoin bullish now?”
The real question is:
Can genuine spot demand remain strong once the short squeeze loses momentum?
That's what matters next.
Don't chase the candle.
Understand what created it.
KryptoPath ⚡
Crypto Intelligence.
