

English & Film Professor/#Educator/#FilmBuff/Mapmaker: House (specialty), County & Precinct Maps/Proud Long Island #ModerateDem/Dad💙👦🏼👩🏼🚫No DMs
Lynbrook, NY (NY-04)
Joined January 2022
- Tweets17.7K
- Following9.1K
- Followers12K
- Likes7.9K




Pinned Tweet
America at 250, Part V - July ‘26 House Predictions
These are NOT safe/likely/lean/tilt ratings. They’re based on the predicted vote shares the winning party will receive.
Based on a GCB of Dem +5.5, Dems are set to gain only modestly in a sort of “reverse” ‘22 scenario. This is largely due to GOP gains from mid-decade redistricting.
BUT, remember that many seats don’t become truly competitive until closer to Election Day, so definitely keep an eye on those light pink/blue seats, or even the slightly darker ones, which could easily turn into sleepers.
As usual, a like, repost and/or follow is always appreciated! 🥹 Happy 4th everyone and a Happy 250th Birthday to the USA!! 🇺🇸 🎆💙🎉
Mappers: @MadLibHatter @bluearrowMaps @SageOfTime1 @Thorongil16 @DemHackMaps @JMilesColeman @RJ_maps @cinyc9 @redwoodcntymaps @NinetyDegreeZ @HugeGuilfordCo @tencor_7144 @josh_metcalf @nnjpolitics @Leonz0_o @ModRightMaps


America at 250, Part IV - 200 Years In
Coinciding with Jimmy Carter’s narrow defeat of Gerald Ford, ‘76 marked the last time to date that either party held a 2/3 House majority.
Dems achieved this by doing well in the cities, while also maintaining a strong grip on the South - despite significant GOP gains over the preceding decade.
Mappers: @MadLibHatter @bluearrowMaps @SageOfTime1 @Thorongil16 @DemHackMaps @JMilesColeman @RJ_maps @cinyc9 @redwoodcntymaps @NinetyDegreeZ @HugeGuilfordCo @tencor_7144 @josh_metcalf @nnjpolitics @Leonz0_o @ModRightMaps

Here’s what the 1912 Presidential election in PA looked like, btw. 😳

🚨12K Followers Appreciation Post!🚨
The 1912 PA US House elections were chaotic. Teddy Roosevelt won the state with only 36%, and it trickled down the ballot. Many candidates were elected with <50% or even <40%.
Not to mention the state gained 4 seats but didn’t redistrict!
Mappers: @MadLibHatter @bluearrowMaps @SageOfTime1 @Thorongil16 @DemHackMaps @JMilesColeman @RJ_maps @cinyc9 @redwoodcntymaps @NinetyDegreeZ @HugeGuilfordCo @tencor_7144 @josh_metcalf @nnjpolitics @ModRightMaps @LeonY1_2
@DJBranham @PAMapper @NickyScatz
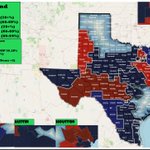
Computers did draw that map. For contrast, here’s a good example of what pre-computer and post-computer maps looked like in TX.


Needless to say that if Brown does pull out a win next month, the map will look just a tad bit different from his first statewide win (aka the battle of the Browns).


Keep in mind that when a pundit changes a race to “Likely,” it doesn’t mean the opposing party is headed for a win. It’s about the margin.
For example, no believed Dems would win the ‘18 OK Gov race, but it’s a classic case of a “Likely” margin win (mid 50s for the winner).


1994: The last year TX Dems won a statewide race. The biggest profile one? AG, where you wouldn’t think the Dem incumbent only got 53%…


It’s hard to say if Rs betting on holding the House (unlikely) and Senate (obviously doable) are doing so out of pure partisanship/loyalty or because they know Rs are doomed and are hoping to cash in if we get a surprise.
Obviously they ended up being right in ‘24…


Nassau Centrist Mapper retweeted

New overall seat count:
223 Safe/Likely/Leans D
200 Safe/Likely/Leans R
12 Toss-ups
My best guess is Dems approach but don't necessarily match 235 seats won from 2018.
NEW Crystal Ball: 28 House rating changes as tally of seats at least leaning Dem surpasses both 218 as well as tiny majorities of the last three cycles
centerforpolitics.org/crysta…


While former Sen Doug Jones is likely the strongest candidate Dems could’ve put forth, the party simply hasn’t had luck with the office this century.
Don Siegelman’s ‘98 win was the last time Dems held the Gov’s office in AL, and he narrowly lost reelection in ‘02.


The Alabama poll | 10/15-10/16
Alabama Governor 2026
🟥Tommy Tuberville 51%
🟦Doug Jones 39%
Link to poll: al.com/politics/2026/10/gop-…

The “subway” in this case being the Long Island Railroad. 🤦🏻♂️
I’ve said many times that if Rs couldn’t beat Hochul in ‘22, it’s not happening this year - even if she’s a crappy Governor. The Cuomo scandal has faded, the crime message isn’t as powerful and the year is bluer.


Bruce Blakeman rides the subway as he rails against Hochul over NYC transit violence trib.al/ymJYjWa

Readers added context they thought people might want to know
The picture in question is not of the subway, but of an LIRR train.
Picture of example seats - queenseagle.com/all/a-new-flee…
I still say Susan Collins will lose by a not-insignificant margin (though not a blowout).
She went from massive blowouts in ‘08/‘14 to getting 51% in ‘20 (yes, I know her MOV was “9%,” but consider 3rd parties). Her crossover appeal has likely sunk further since then.


Okay, QGIS behaved itself and I was able to pump out the 1990 US House map for the Midwest. In a generally strong year for the party, Dems maintained a 63-40 advantage in the region, netting 3 seats.
In case you’re wondering, no, that’s not a misclick on the Madison, WI CD. 😳

Wanted to stay in the year 1990, so here’s what the US House map looked like that year in my state. And no, that’s not an error on that East Side Manhattan CD.
FYI: I was working on a Midwest map for that year before QGIS crashed on me. 😫
Mappers: @MadLibHatter @bluearrowMaps @SageOfTime1 @Thorongil16 @DemHackMaps @JMilesColeman @RJ_maps @cinyc9 @redwoodcntymaps @NinetyDegreeZ @HugeGuilfordCo @tencor_7144 @josh_metcalf @nnjpolitics @ModRightMaps @LeonY1_2
@RyanGirdusky @admcrlsn
According to the data, many of the betting market traders (60+%) are suburbanites. This will play an outsized role in TX in particular. As many urban/rural counties shrank or stagnated, suburban counties boomed.
Rs won most in ‘24. The question is how much they’ll swing left…


If Beau Bayh is able to win the IN SoS election, he would be the first Dem to win the office since (now-Indianapolis Mayor) Joe Hogsett.
The SoS before Hogsett? *Evan* Bayh


Whenever I hear the term “dummymander,” I can’t help but reminisce about the 2010s OH map - the ultimate *anti-dummymander.*
I mean seriously, how did this map hold up so well for Rs when so many other gerrymanders collapsed? 😹

Actually a pretty solid tool here, even if you’re skeptical of betting markets. Not only does it show the betting odds for all federal and state races, it shows things like endorsements, ballot measures, etc. and uses data from VoteHub, Ballotpedia and other reliable sources.

Remember, like Joe Walsh, Ken Buck was considered a radical Tea Party candidate when he ran for Senate in 2010.
Now, they’re both endorsing Dems. Oh, how times change…

Colorado Politics: Former Rep. Ken Buck (R-CO) endorses Phil Weiser (D) for Colorado Governor
coloradopolitics.com/2026/10…
