

On a mission to master markets and life. Trading stocks with momentum using the Heatseeker & EMA's Linktree - https://teapawt.org/t.co/IGmRHjR6ef
Heatseeker Access 👉🏼
Joined October 2023
- Tweets28.5K
- Following464
- Followers18.5K
- Likes24.6K






Pinned Tweet
On the 22nd of August $IREN - $CIFR both where at all time high institutional ownership yet they both dropped a lot since then.
$CIFR -48%
$IREN -45%
Ownership at new highs, but price dropped...
Well... These Institutional Ownership chart hides something.
You see big increases on the chart, but net ownership increases didn't move that much, but short interest has for $IREN - $CIFR.
That's the thing you need to watch. Did the net ownership rise % wise compared with the chart or did short interest solely increase.

WHAT THE OWNERSHIP CHART HIDES⁉️
$IREN - $CIFR
Institutional ownership charts lie a little actually...
When a fund lends shares to a short seller, both the lender and the new buyer report them. Same share, counted twice.
$IREN: real buying happening here. Shorts at record highs do inflate the chart a bit, but the accumulation underneath is genuine. And with the open ATM this does offset it as well actually.
$CIFR: the jump looks impressive until you check what's behind it. Net shares flat, the founding shareholder sold a third of its position, shorts almost doubled. Not the buying wave the chart suggests.
So you see big increases, but net ownership increases didn't move that much, but short interest has for $IREN - $CIFR. And that is something you need to consider as well.
$CLSK reached +100% institutional ownership earlier this year, why? Because shorts kept doubling down...


$APLD flashing a possible triple bottom.
Couldn't quite hold Floor $18.5, but it's chopped sideways for a week or two now, which is decent even if it doesn't confirm support yet.
Tried twice to clear the 8 EMA and failed both times, that's the first real challenge, and buyers need to step up there.

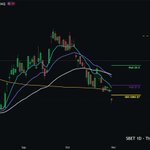
$SBET sitting in no man's land.
Losing the EMAs and the 200 MA, with a level near $10 still out there above, but it needs real support first, and this doesn't feel like it yet.
Not a time to force anything here, just watching and looking for relative strength elsewhere.

$TE finally showing some life.
Bullish price action after months of straight decline, bouncing near the $2.08 level that also kicked off $TE's near-100% rally back in October 2025.
Reclaimed the 8 EMA and holding above it, a red or sideways day wouldn't even be a bad thing after four straight green days.

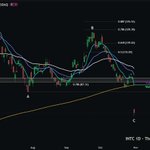
$INTC just had a brutal gap down.
Nearly 30% move to the downside on Friday, wild to see on a name like this.
Gapped straight below another fill zone sitting between roughly $70.60 and $80, so a slow grind back up to fill that over the coming weeks or months is possible, but no rushing in until there's more clarity.

$NBIS rejected clean at the 8.
Lost every EMA and just put in a textbook bearish retest, getting rejected hard at the underside of the 8 EMA, looks headed toward a level near $115.
Chart's rough right now, probably needs months to stabilize before anything changes.

$KEEL closing in on a key gap.
Only real target right now is the gap fill sitting at $1.99, and price is already right there.
Curious whether that fill brings in buying power or if it just keeps sinking through.

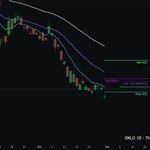
$OKLO still searching for a floor.
Stuck in the same downtrend, still needs to find real support before there's anything to say about it.
Wanted Floor $26 to hold, but it sank right through, just watching what this week brings.

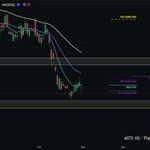
$ASTS testing the same zone that held before.
Retesting the support zone that also worked back in September 2025, which is encouraging, but it still can't reclaim the 8 EMA.
Gap's filled now, so just waiting to see what the price action actually does from here before calling anything.


$MSTR all eyes on bitcoin:native
Could be wave 4 with one more wave 5 extension up, but losing every EMA on both weekly and daily isn't bullish.
GEX $125 got touched last week, which could hint at a reversal, but taking this one slow and waiting to see what Bitcoin does first.

$BMNR waiting on its ethereum:native cue.
Not looking too bad, but not one to rush into, this move is really tied to what Ethereum does next.
Could be testing the 200 weekly as wave 4, with a possible wave 5 extension toward $40 after that, so taking this step by step.


$RKLB flashing pure bearish signals.
Rejected right back below the weekly 8 EMA, couldn't reclaim the 50 EMA these past few weeks, and sits below every EMA on the daily too.
Definitely one to think twice about holding right now.

$SIDU still can't shake the weakness.
Same story as before, no real support found yet, so not much interest here right now. Only level worth watching is roughly the current price, since a similar spot sparked a big extension last time.
Waiting to see if that plays out again.

$SOFI just back in its range, not gone.
Reclaimed the weekly 8 EMA, still working on the 21, and the daily looks solid aside from the 200 MA still in the way.
Chart's improving, but remember this has been consolidating in the same range for almost a year now, watch for the breakout.

$ASST not looking too bad here.
Levels need to hold around the 21 EMA, but there's still plenty of room for extension given the insane +1200% move back in April 2025.
Not rushing into this one, waiting to see what the wider market does first.

$ONDS flashing a possible double top.
Rejected at the weekly 8 again, and zoomed out this could be the tail end of the whole range built from March 2023 to June 2025.
Watching if GEX $6 holds, if not, a test of the 200 MA at $3.53 is quite possible.

$CLSK stuck in the same range for 2 years.
Never had a real breakout, just chopping between $7 and $20 since early 2024, which actually means plenty of room to run once it does break.
Right now watching where support holds, with VEX/GEX $8 the nearby level and $6.55 the next stop if that gives way.

$CIFR loses a level it shouldn't have.
Broke below the 200 weekly, which wasn't expected, a retest and reclaim is possible, but this week's close isn't bullish.
GEX $7 could act as a pull level for a bounce, though last time this MA broke it led to a 54% drop, which would put $3-3.50 in play if it repeats.
