

Charts, process, and analysis on stocks and indices. The Mando Model, daily. NFA
Joined August 2020
- Tweets61.2K
- Following571
- Followers42.7K
- Likes102K




Pinned Tweet
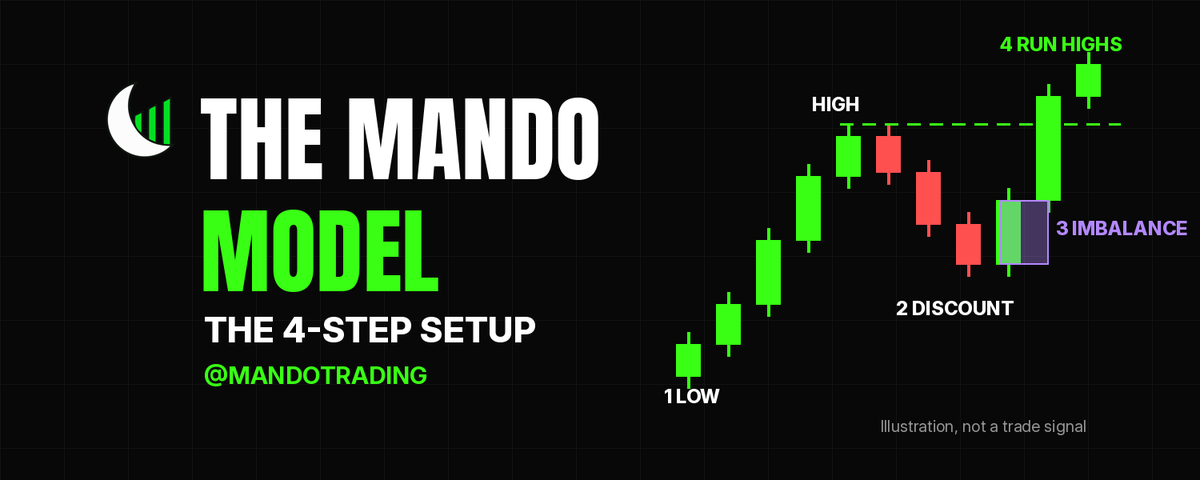
I broke down the exact 4-step process I use on every chart: higher time frame context, wait for the discount, find the imbalance, and let price run to liquidity. The full Mando Model, start to finish. 📖


Years of accurate market reads. Not luck. The real ones know.
Plenty of people will come and go. I’ll still be here. Stick around long enough and you’ll see it, too…
The other analysts won’t give me credit because they know they’re not on this level and if we ever got on the mic it would be a bloodbath…
The market is my fiddle, and I’ve been playing it a long time.

Nice slap to AM highs on live this morning…
Just take care of the higher time frame draw and I’ll happily start loading again… $SPY

Going to be so many good opportunities very soon and $ORCL will be one of them…
The yearly imbalance is coming at 101.74 and takes some liquidity at $99 👀

$ORCL
A little more to go to get down into the yearly bullish imbalance starting at 101.74
Quarterly sellside is at 99.26, which I think is necessary, and from there I'd happy to take this long term and build a position inside of this higher time frame support


Stay up to date with my content on YouTube!
youtu.be/f0aqLdxqpMY

5 things I check before I take ANY trade.
Most traders skip #3.
Bookmark this and run it before your next entry. 🧵

6. The goal isn’t more trades
It’s fewer, cleaner ones where you already know the plan before you click